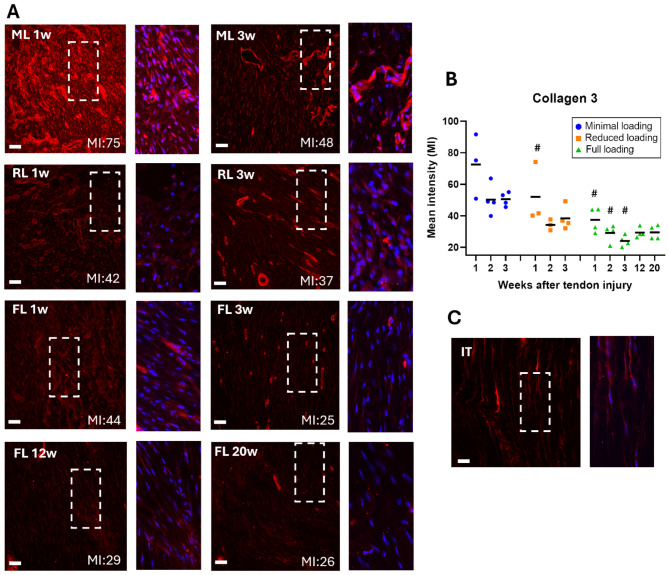
Fig. 4.
Higher mean intensity for collagen 3 in unloaded tendons. (A) Immunofluorescent staining for collagen 3 (red) in healing Achilles tendons at different time points after tendon injury and exposed to different loading conditions (ML: minimal loading, RL: reduced loading, or FL: full loading). Images were taken in the middle of the tendon tissue. Magnification of the marked areas show staining of collagen 3 (red) and cell nucleus (blue). (B) Mean intensity (MI) of collagen 3 for all individual tendons (dots) and mean (black line) for each group. (C) Intact tendon (IT), shown as a reference. There was a significant effect of load levels and time-points during the early tendon healing. Scale bar 50 μm. # denotes a significant difference from minimal loading at the equivalent time point.

