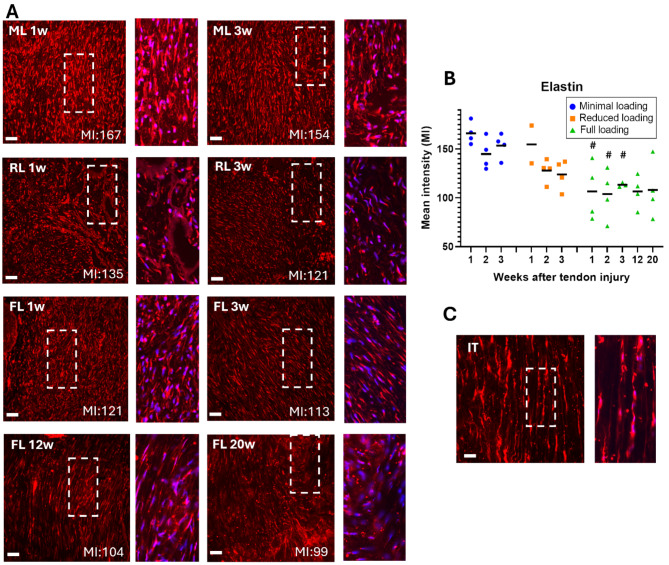
Fig. 5.
Higher mean intensity for elastin in unloaded tendons. (A) Immunofluorescent staining for elastin (red) in healing Achilles tendons at different time points after tendon injury and exposed to different loading conditions (ML: minimal loading, RL: reduced loading, or FL: full loading). Images were taken in the middle of the tendon tissue. Magnification of the marked areas show staining of elastin (red) and cell nucleus (blue). (B) Mean intensity (MI) of elastin for all individual tendons (dots) and mean (black line) for each group. (C) Intact tendon (IT), shown as a reference. There was a significant effect of load levels during the early time-points. Scale bar 50 μm. # denotes a significant difference from minimal loading at the equivalent time point.

