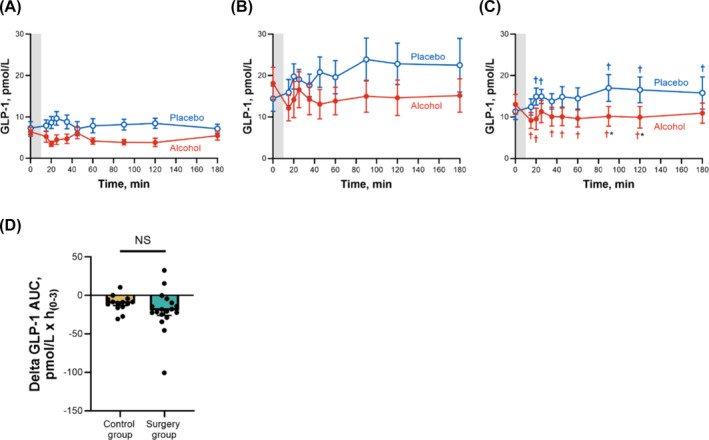
FIGURE 2.

Differences in plasma GLP‐1 concentrations for control and surgery groups after ingestion of alcohol and placebo drinks. Effect of ingesting an alcohol drink (0.5 g/kg fat‐free mass; ~1.7 standard drinks; red closed symbols) compared with drinking a non‐alcohol version of the same drink sprayed with 2 ml of alcohol (placebo; blue open symbols) over 10 min (grey bar) on plasma GLP‐1 (A–C) for the control group (A; n = 14), for the surgery group (B; n = 18) and for both groups averaged (C; n = 32). Data in D represent the difference in AUCs within conditions (alcohol minus placebo) for each participant between groups for plasma GLP‐1. Plasma GLP‐1 concentrations were analysed using separate general linear mixed model (PROC MIXED) analyses. Condition (placebo and alcohol), time and group (control and surgery), as well as all interactions, were included in the model and treated as fixed effects, and subject was included as random effect. Post hoc Fisher's least significant difference was used when interactions were statistically significant. Main effect of group: F (1,30) = 11.62, P = 0.002; time × condition: F (9,270) = 2.72, P = 0.005 (C); time × condition × group: F (9,270) = 1.77, P = 0.07 (A and B, no post hoc shown because no significant triple interaction). Individual differences in GLP‐1 AUCs between alcohol and placebo conditions (delta GLP‐1 AUC) were analysed using a two‐sample independent t‐test. t (23) = 1.32, P = 0.20. Data are presented as mean values ± SEM, and D includes individual data points within each group. *Signifies difference from placebo at P < 0.05. †Signifies difference from baseline value within each condition (blue symbol for placebo and red symbol for alcohol) at P < 0.05.
