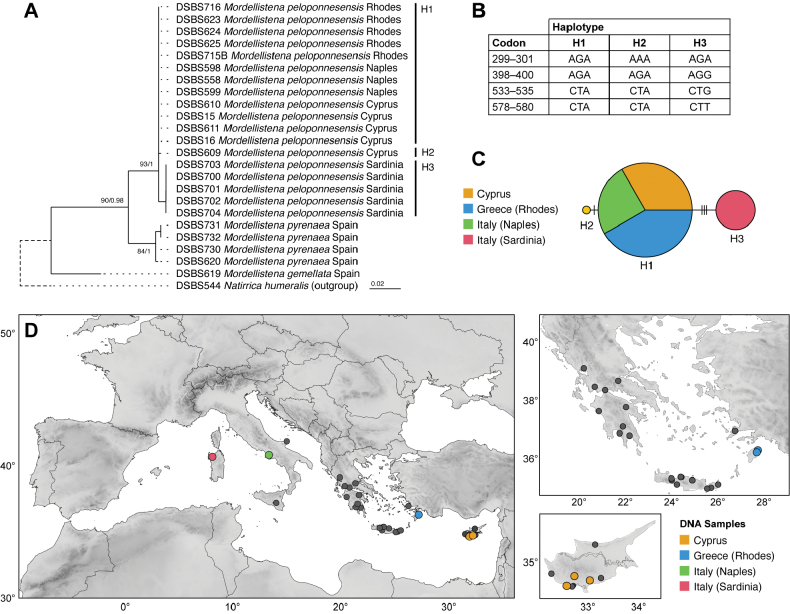
Figure 2.
A results of maximum likelihood analysis of 658 bp COI fragment; support values are given as: bootstrap values / aBayes test values B differences between haplotypes of Mordellistenapeloponnesensis Batten, 1980. Codons are marked as the nucleotide positions within 658 bp COI fragment C TCS haplotype network based on eighteen sequences of 658 bp COI fragment in M.peloponnesensis; colours represent sampling localities; vertical lines represent number of substitutions D distribution of M.peloponnesensis; left: entire range, right: details on Greece, Turkey, and Cyprus. Localities of DNA samples are marked with coloured dots matching those in the haplotype network; localities without DNA samples are marked with black dots.

