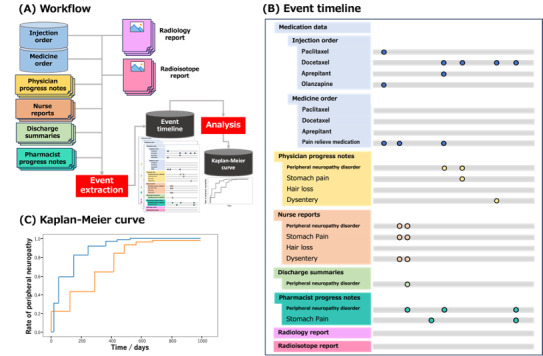
Figure 1.

Data flow of the proposed system. (A) shows the events from multiple types of documents are extracted. An event timeline (B) is created from each clinical data using the natural language processing method, and then the curve (C) is created based on the aggregated results. The dots in the event timeline indicate the timing at which the description of drug administration or symptom onset is recorded. Based on (B), patients who received the target drug (a taxane drug in this study) are selected, and the Kaplan-Meier curve (C) is generated.
