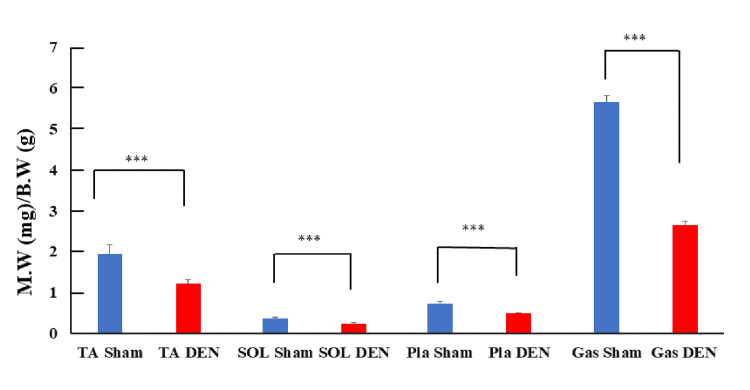
Figure 1. Comparison of wet muscle weights between DEN and Sham control limbs. Ratios of wet muscle weight (M.W) (mg) to body weight (B.W.) (g) are shown.
Data are shown as mean ± standard deviation. *** p < 0.001; TA: tibialis anterior; SOL: soleus; Pla: plantaris; Gas: gastrocnemius; DEN: denervation

