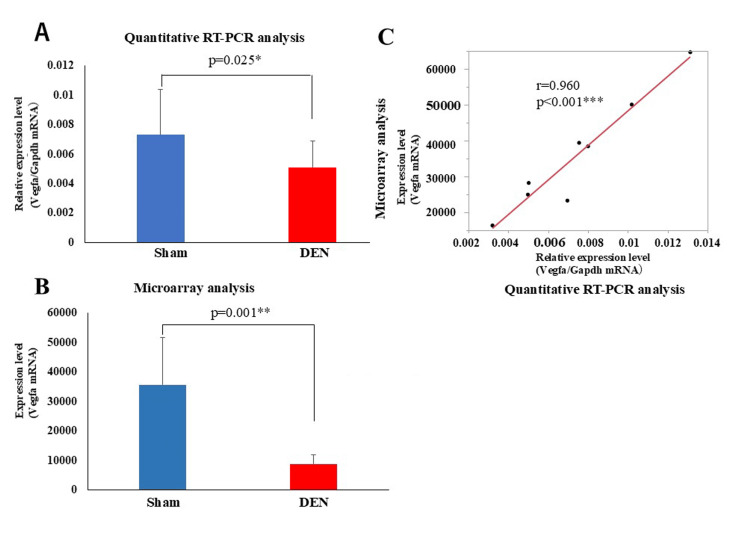
Figure 3. Comparison between quantitative RT-PCR and microarray analyses to assess VEGFA mRNA expression levels. (A) Quantitative RT-PCR and (B) microarray data. Data are shown as mean ± standard deviation. *p <0.05, **p < 0.01 (C) Correlation between RT-PCR and microarray data. r-value and p-value are shown ***p < 0.001.
RT-PCR: reverse transcription-polymerase chain reaction; VEGFA: vascular endothelial growth factor A; DEN: denervation

