

Abstract
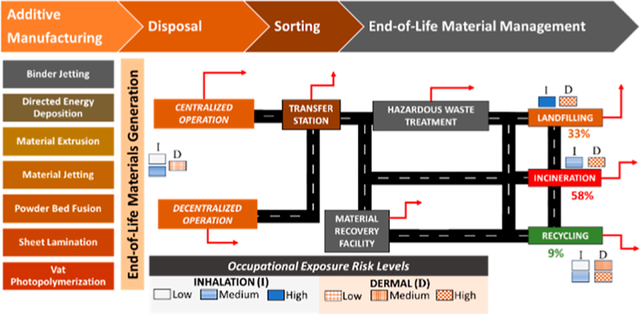
Additive manufacturing (AM) offers a variety of material manufacturing techniques for a wide range of applications across many industries. Most efforts at process optimization and exposure assessment for AM are centered around the manufacturing process. However, identifying the material allocation and potentially harmful exposures in end-of-life (EoL) management is equally crucial to mitigating environmental releases and occupational health impacts within the AM supply chain. This research tracks the allocation and potential releases of AM EoL materials within the US through a material flow analysis. Of the generated AM EoL materials, 58% are incinerated, 33% are landfilled, and 9% are recycled by weight. The generated data set was then used to examine the theoretical occupational hazards during AM EoL material management practices through generic exposure scenario assessment, highlighting the importance of ventilation and personal protective equipment at all stages of AM material management. This research identifies pollution sources, offering policymakers and stakeholders insights to shape pollution prevention and worker safety strategies within the US AM EoL management pathways.
Keywords: generic exposure assessment, material flow analysis, additive manufacturing, end-of-life
Graphical Abstract
1. INTRODUCTION
Existing additive manufacturing (AM) techniques stand out for their ability to produce precise objects for diverse applications, from medical implants to mechanical components and personal creations.1 Given the versatility, AM techniques can use a large variety of material types during production but can also create many possibilities for environmental releases and potential chemical exposures throughout the life cycle of these materials. Prior studies have focused on quantifying releases from various AM practices to evaluate occupational safety risks.1–5 However, uncertainty persists concerning the destination and allocation of end-of-life (EoL) materials after postmanufacturing because EoL materials from AM are often intermingled with other EoL streams, complicating the identification of specific issues related to their generation and releases and hindering the formulation of targeted solutions for pollution prevention, source reduction, and material circularity.6 Unlike centralized manufacturing facilities, AM operations can also be decentralized, which are more geographically dispersed and not subjected to the same stringent regulations as the centralized AM operation. These differences contribute to a heightened risk of improper disposal and environmental releases. Moreover, EoL materials originating from AM have not been systematically tracked by any specific entity because the volume of EoL material generated by AM practices is expected not to match that of commonly manufactured products. However, investigating the contribution of individual practices can help identify and address specific challenges related to managing AM EoL materials, environmental releases, and occupational exposures. Discarded EoL materials can be dispersed into waste management pathways and the environment, making material tracking difficult beyond the point of EoL material generation. In response to these complexities, this research performs a material flow analysis to address the uncertainty in material flows and an exposure assessment to find the sources of pollution, releases, and opportunities for minimizing hazardous material exposure throughout AM EoL material management.
AM processes encompass seven main categories: vat photopolymerization, material jetting, binder jetting, powder bed fusion, material extrusion, sheet lamination, and directed energy deposition.1,7 Each category can be subdivided into liquid and solid-based processes with unique materials that may enter the EoL management stage. Common materials used as feedstocks in the AM may include a variety of photocurable polymer resins, solid polymers, metals, composites, glass, and ceramics, each with varying physical and chemical properties.7–9 These diverse material types pose challenges in the EoL material management stage, resulting in release and occupational exposure sources, such as container unloading releases, expired raw materials, equipment cleaning losses, and EoL material generated during printing operation and postprocessing.10–15 Large centralized AM operations are more likely to implement safety features within their workspace, mitigating possible releases at the source. Unlike conventional manufacturing, EoL materials generated by AM practices can originate from smaller decentralized AM operations, resulting in a broader array of EoL material types sent to the EoL management stages through the most convenient methods (e.g., drainage, municipal solid waste (MSW), and recycling bin) without a full understanding of the environmental and health implications. These material types stem from different AM processes, postprocessing, and disposal methods adopted by operators of varying skill and knowledge levels.16 Understanding the environmental releases, impacts, and occupational risks from these differences is pivotal for informed decision-making, ensuring material circularity, sustainability, and safety across the AM product life cycle.
There is limited information on the impact of material allocation, environmental releases, and safety within the management pathways of EoL materials originating from various AM practices. Therefore, a material flow analysis of AM EoL materials can be a crucial first step for identifying the possible material allocation and points of interest, such as mass releases, which can lead to occupational hazard potentials throughout the AM EoL management.17 A generic exposure assessment can then identify common exposure scenarios encountered by EoL material management workers.15 The material release and human exposure data from the AM EoL material management can supply information for evaluating the potential environmental and human health impacts throughout the AM EoL material management infrastructure. This research bridges the knowledge gap across the life cycle of AM products by focusing on the EoL materials generated and comprehensively examining the material pathways and the associated environmental and health implications. Stakeholders, such as the US Environmental Protection Agency (EPA) and Occupational Safety and Health Administration (OSHA), can then formulate targeted strategies for pollution prevention, source reduction, improved occupational safety, and promoting sustainable AM practices. This work enables stakeholders to grasp the potential consequences in the latter stages of the product life cycle and provides a starting point for future studies aimed at advancing the overall sustainability and safety of end-of-life material management practices.
2. METHODS
Existing AM exposure research primarily measures material emissions during the manufacturing stages of AM. However, there are uncertainties regarding potentially hazardous EoL material generation, chemical releases, and occupational exposure information for AM materials during the EoL stage of the AM products’ life cycle, which includes disposal, treatment, and recycling processes. Public databases, such as RCRAInfo (Resource Conservation and Recovery Act Information) and TRI (Toxics Release Inventory), organize data based on the NAICS (North American Industry Classification System) code. AM can be placed in multiple NAICS codes, leading to challenges in aggregating data pertaining to EoL materials generated and released through AM practices. Additionally, while AM practices generate EoL materials containing hazardous chemicals and release toxic chemicals, they generally do not meet the reporting thresholds for databases such as RCRAInfo and TRI.18,19
2.1. Material Flow Analysis.
A material flow analysis estimates the quantity and allocation of AM EoL materials, drawing insights from review papers, research articles, and AM material management guidelines.2–5,20–23 Many similarities between the EoL stage of the AM and MSW management infrastructure can be identified due to the types of products and EoL materials generated.15,24 The mass basis for the material flow analysis was selected based on the annual 3D printer usage in the United States reported in the Wohlers Report.25 Further allocation estimations between liquid and solid-based processes rely on industry landscape reports by AMFG.26 This report named manufacturers, businesses, vendors, suppliers, and research institutions that use AM techniques. The frequency of AM technique usage was tallied to approximately 35% of companies using liquid printing processes and 65% using solid-based printing processes. All common material types contributed by AM to the EoL stage are summarized in Table 1, while a more comprehensive list can be found in Table S1 of the Supporting Information. The assumptions and calculation details for the material flow analysis are listed in the Supporting Information.15,20,22,23,25–36
Table 1.
Major Material Types Entering End-of-Life Material Management from AMa
| material types | additive manufacturing categories |
|---|---|
| ceramic (s) | MEX/PBF |
| composite (s) | MEX/PBF |
| glass (s) | BJT/DED/MEX/PBF |
| metal (s) | DED/MEX/PBF |
| lipid (s) | MEX/MJT |
| paper (s) | SHL |
| photopolymer resin (l) | MJT/VPP |
| polymer (s) | BJT/MEX/PBF |
| solvent (l) | MJT/VPP |
| wood (s) | MEX |
Note: BJT = binder jetting, DED = directed energy deposition, MEX = material extrusion, MJT = material jetting, PBF = powder bed fusion, SHL = sheet lamination, VPP = vat photopolymerization.
2.2. Generic Exposure Assessment.
The generic exposure assessment integrates potential release events and occupational exposures during postmanufacturing, disposal, treatment, and the subsequent EoL management methods. All analyses were completed on a worst-case basis to supply an approximate range of health impacts at the maximum potential. Descriptions of typical operating procedures were supplied for each major operation to emphasize the differences between EoL management options. The equations for exposure estimation were adapted from the US EPA Exposure Factors Handbook in cases with limited data, which can be addressed by parameter estimation.37 Experimental exposure and chemical concentration data were used, where appropriate, to reduce the uncertainty of the generic exposure assessment.4,21,23,29,38 Occupational exposures were estimated based on dermal and inhalation routes.
Equation 1 describes the potential worst-case dermal exposure () that workers may encounter for a given process (i). S is the average surface area for the palm of both hands (1070 cm2). Q is the amount of material retained on the skin after exposure.37,39 is the fraction of the chemicals in the substance upon dermal exposure in a given process. This approach has considered hands the most frequent contact point with many objects, tools, equipment, and substances during AM EoL material management. Additionally, eq 2 describes the general inhalation exposure () estimation for an EoL process based on the concentration of substances in the working area of a given process, , rate of breathing () of 1.25 m3/h,40 and time of exposure ( of 8 h/day), and the fraction of volatile materials in the inhaled substance from a given process (). This fraction value represents the mass fraction of the chemical or material of concern in the volatilized liquid or aerosolized solid. varies depending on the surrounding environment. Table 2 summarizes the concentration parameters used for the occupational exposure modeling.
| (1) |
| (2) |
Table 2.
Occupational Exposure Calculation Parameters
| parameter | description | value | reference | |
|---|---|---|---|---|
| dermal exposure | ||||
| S | average surface area of contact | 1070 cm2 | 41 | |
| Q | amount of materials retained on skin after exposure | liquid: 0.7–2.1 mg/cm2 | 41 | |
| solid: 0.13–0.27 mg/cm2 | ||||
| Fchemical,i | fraction of the chemicals in the substance upon dermal exposure in process i | disposal: | •[LIQUID] 0.95 | 15,21,27,41,42 |
| •[SOLID] 1 | ||||
| postdisposal: negligible incineration: 1 | ||||
| recycling: | •[PLASTIC] 0.0005–0.70 | |||
| •[METAL] 1 | ||||
| •[GLASS] Negligible | ||||
| landfilling: 1 | ||||
| Nexp | number of exposure incidents | 1 incident/day/operator | 41 | |
| inhalation exposure | ||||
| Cexposure,i | concentration of substances in the working area of process i | disposal: | •[LIQUID] 0.01–40 mg/m3 | 11,15,43–;45 |
| •[SOLID] 0.02–0.13 mg/m3 | ||||
| postdisposal: negligible incineration: 15 mg/m3 | ||||
| recycling: | •[PLASTIC] 15 mg/m3 | |||
| •[METAL] 0.55–77.8 ng/m3 | ||||
| landfilling: 11–7200 mg/m3 | •[GLASS] 0.18 mg/m3 | |||
| rbreathing | rate of breathing | 1.25 m3/h | 40 | |
| texposure | time of exposure | 8 h | 40 | |
| Fmaterial,volatile,i | fraction of volatile material of concern in the inhaled substance from process i | disposal: | •[LIQUID] 0.95 | 21,46,47 |
| •[SOLID] 1 | ||||
| postdisposal: negligible incineration: 1 | ||||
| recycling: | •[PLASTIC] 0.0005–0.70 | |||
| •[METAL] 1 | ||||
| •[GLASS] 1 | ||||
| landfilling: 1 | ||||
3. RESULTS AND DISCUSSION
AM is unique from other manufacturing techniques due to its potential for both centralized and decentralized operations. Decentralized operation enables users to create solid objects of their choice regardless of skill level and location. However, this convenience can create challenges in EoL material management and regulatory oversight. For example, household users may inadvertently contribute to the release of AM EoL materials into the environmental compartments due to a lack of awareness about proper material-handling practices, such as discarding failed prints or excess raw materials directly to the MSW stream without proper treatment. These substances can contaminate land mass and water supply, as some parts may degrade into more toxic substances over time.48 Additionally, EoL liquid resins, water-soluble materials, or fine powder residues from postprocessing (e.g., sanding) may enter the sewer system through household drains, contributing to water releases. Therefore, decentralized AM operations contrast with centralized manufacturing operations, which are subjected to more stringent regulations. Tracking decentralized releases is difficult because they do not meet the minimum reporting threshold. Specifically, the TRI Program requires that a chemical neither listed as a chemical of concern nor PFAS should be reported if it has been (1) manufactured/imported/processed in excess of 25,000 pounds or (2) used in excess of 10,000 pounds for the calendar year.49 Decentralized AM operations are not anticipated to exceed these values, causing most of the AM EoL materials generated to go unreported. Given this data limitation, a holistic overview of the collective practice of centralized and decentralized operations was used to create a mass flow basis into AM EoL material management. Subsequently, the material flow analysis of AM EoL management in Section 3.1 calculates the potential mass allocations originating from AM practices. The generic exposure assessment in Section 3.2 analyzes the potential health risks to EoL management workers as a function of releases to the environmental compartment estimated from Section 3.1. Section 3.3 summarizes the research findings and discusses possible actions to mitigate the potential health risks.
3.1. Material Flow Analysis of AM End-of-Life Management.
The starting point of the material flow analysis for tracking the AM mass distribution throughout EoL management is based on Wohlers Associates estimation of 870,000 annual AM operational units in the United States, which equates to 10.44 million kg/yr of materials processed.25,50 It should be noted that this mass basis is not an absolute number that remains true between analysis years. Instead, this value is used as a starting point to determine the potential mass allocation during the end-of-life material management stage. The generated EoL materials may vary between 1 and 40% of the material input (10% average), corresponding to 104,400–4.18 million kg (1.04 million kg average) overall annual material discard rate.23 Up to 35% of the generated materials were estimated to result from liquid AM processes, while the remaining materials resulted from solid AM processes.26 The average process mass rate was distributed according to these percentages. Figure 1 illustrates the connection between the manufacturing of AM-specific products and the EoL material management stage. Release streams are shown to signify areas of potential mass loss due to limitations in the processing methods. All parameters and assumptions used for the material flow analysis calculations are tabulated in Table S2, and stream calculation results are shown in Table S3.
Figure 1.
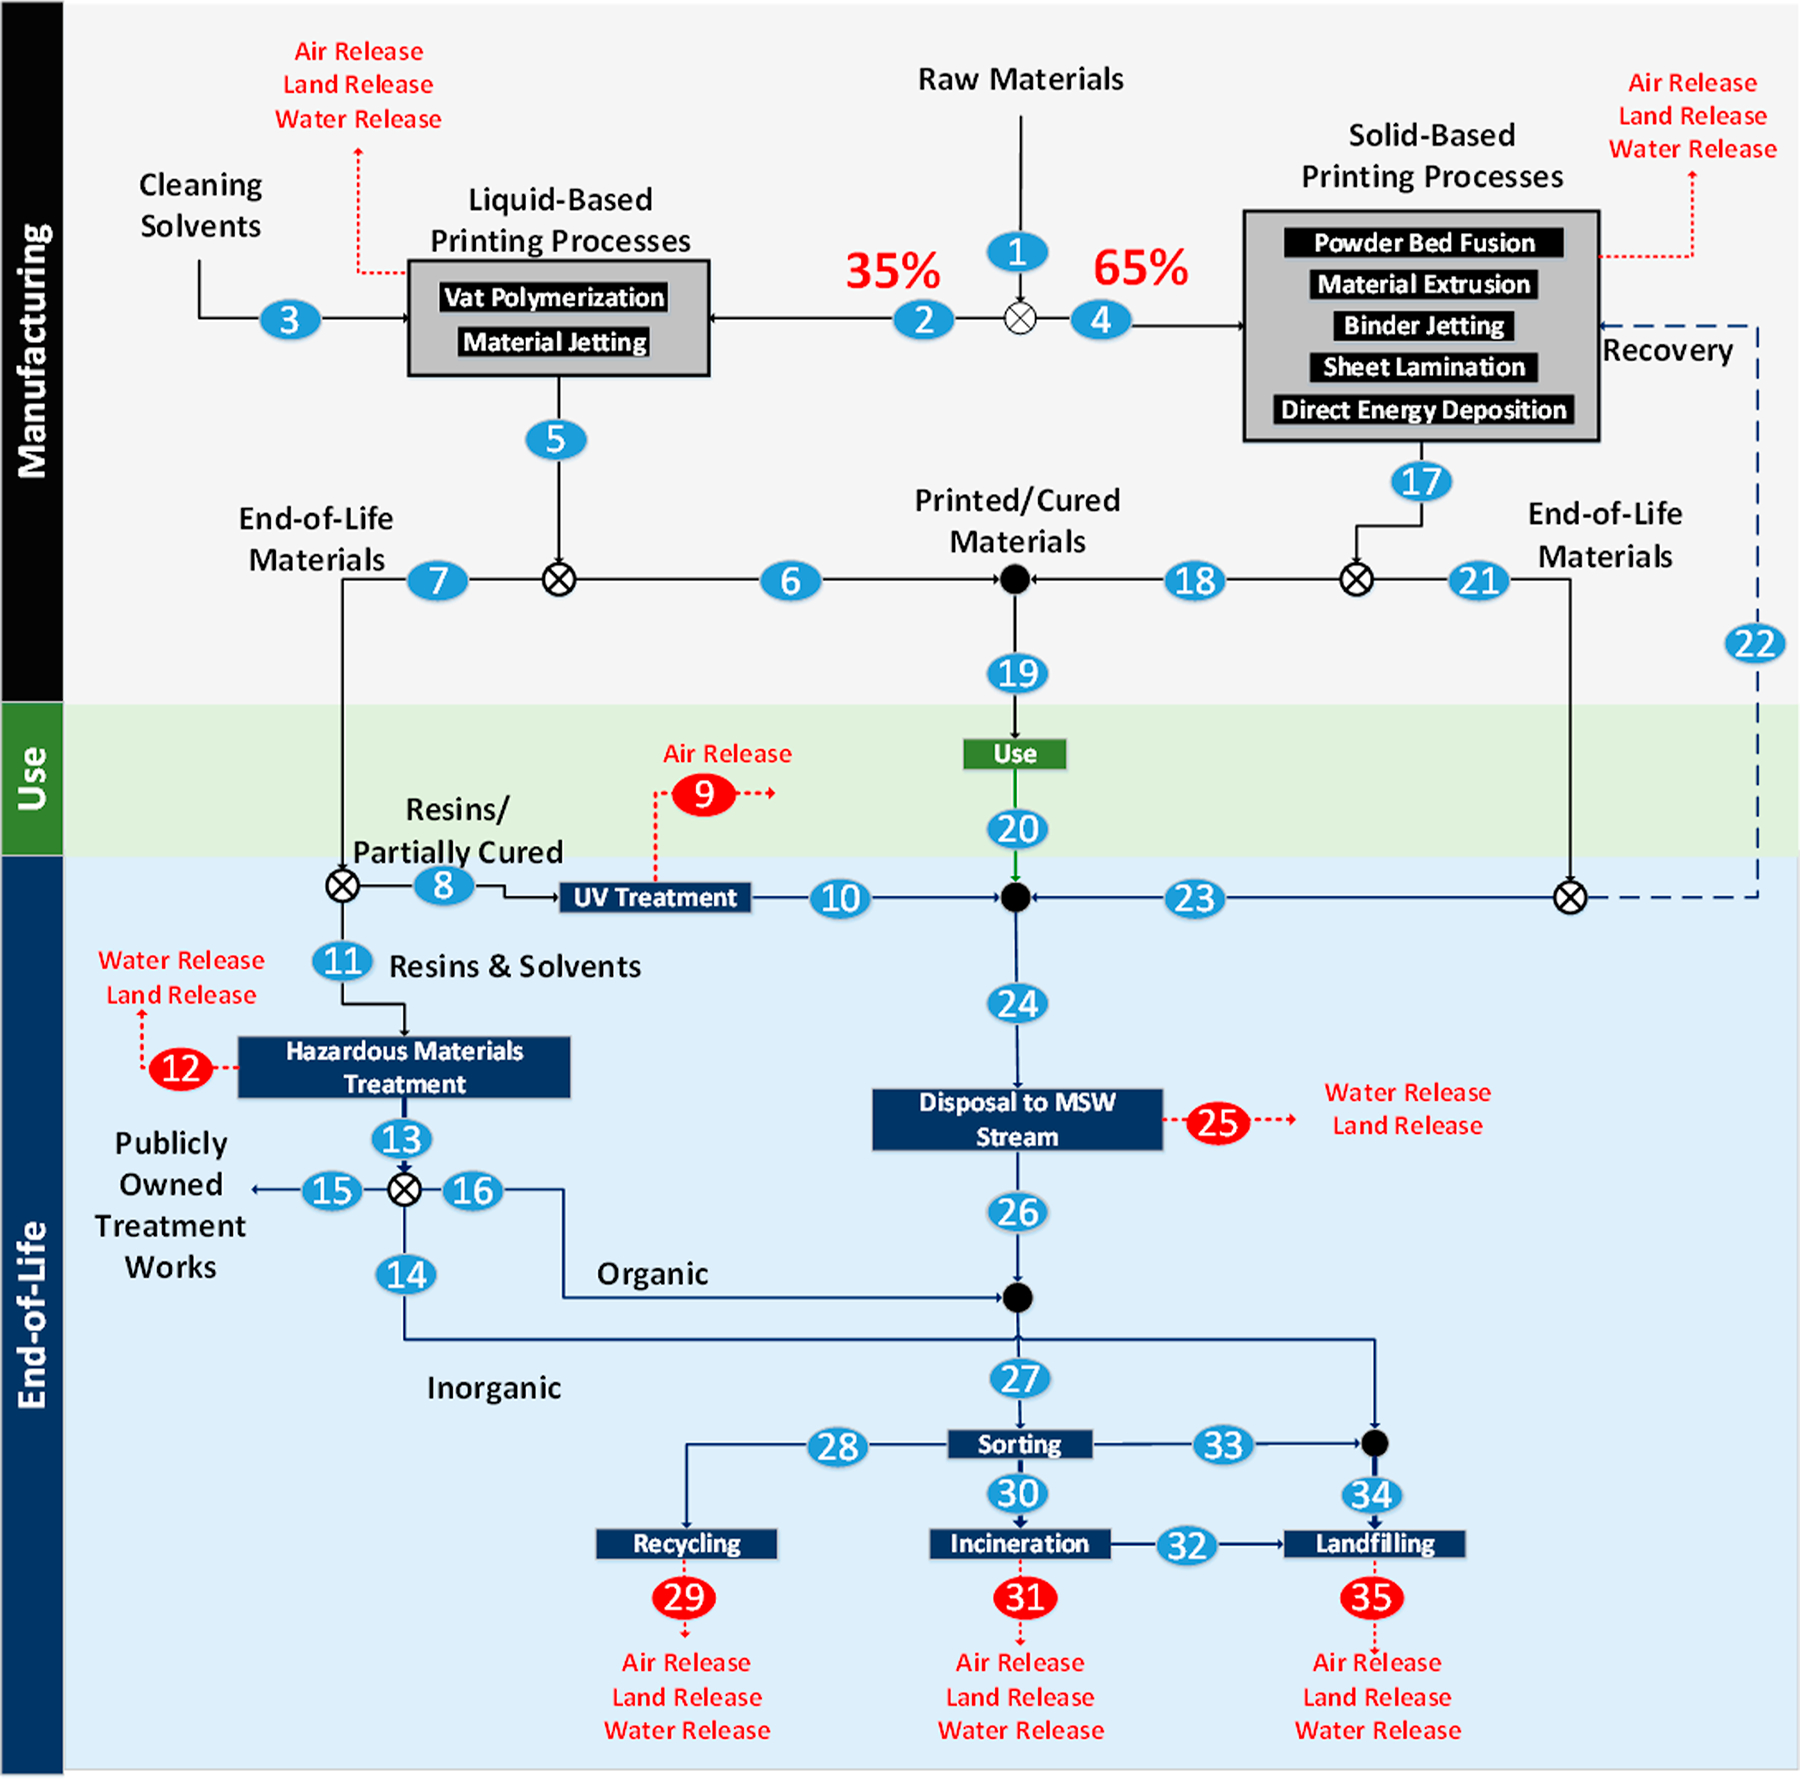
Material flow diagram of potential pathways of end-of-life materials contributed by AM practices. Blue-colored background streams represent the primary end-of-life material flow path, while red-colored background streams represent environmental releases to land, water, and air.
All major EoL material pathways originating from the AM product manufacturing stages were considered. The liquid printing process can discard up to 3.65 million kg of raw materials, cured and expired resins, test prints, prototypes, and failed prints (stream 2). Wash solvent can clean residues from the final products and printers for future use. The solvent consumption ratio has been estimated to be approximately 6.5 kg/kg product, totaling 21.4 million kg of solvents/yr (stream 3). These streams combine to form stream 5, which can be sorted into stream 6 (product) and stream 7 (end-of-life materials). The mass allocation for streams 8 and 11 from stream 7 was found based on the failure rate of a typical print. Generally, failed prints may be caused by axis misalignment, poor print bed adhesion, insufficient support, layer shifts, and the complexity of the object.51 The failure rate may occur between 1 and 10% (5% average) for an experienced user, resulting in 5% of the material being sent to MSW after ultraviolet (UV) light treatment (stream 10).52 This treatment requires resins and partially cured materials to be cured under UV light or exposed to natural light for an extended period. The resulting solidified materials can then be disposed of through common MSW infrastructure. Uncured and expired resins (stream 11) with organic wash solvent may also be sent to an EoL material broker facility for distribution to the appropriate treatment or disposal site according to the material characteristics.53 The liquid EoL material treatment options may include biological, chemical, physical, stabilization, and thermal options.54 However, physical and thermal treatments are likely the primary options for handling AM-specific EoL material because its content primarily comprises organic compounds. Specifically, solid materials in the liquid EoL stream may partially be separated from the liquid component. Hazardous EoL material from AM practices can enter publicly owned treatment works (POTWs) through input into the sewer system and illegal dumping (streams 12 and 15), introducing additional halogenated organic compounds that can be resistant to biodegradation.55,56 This entry to POTWs is treated as a form of release to water because these chemicals are not easily removed through conventional POTW treatment; therefore, the disposal must follow local regulations and guidelines by authorized material disposal services. After treating liquid EoL materials, the solid sludge (stream 14) is sent to landfilling for final disposal. Resins and contaminated organic solvents (stream 16) may be sent to incineration, recovery at specialized facilities, or disposal, depending on regional capabilities.6
Alternatively, solid printing may generate up to 6.79 million kg of materials (stream 17) annually with a potential EoL material range between 67,860 and 2.71 million kg (678,600 kg average). This EoL material flow (stream 21) may have scraps, prototypes, and test prints. Material recycling (stream 22) is possible by feeding scraps into a filament extruder.5 However, due to economic constraints, solo AM users do not justify buying a filament extruder solely for this purpose. Therefore, recycling is negligible along this EoL path.
All printed materials (stream 19) are used until their eventual disposal (stream 20). Although the process is not at a steady state, the accumulation was set to zero because the primary goal is to track the mass flow to the eventual destination throughout the AM EoL pathways. The printed parts and scraps from all AM process EoL flows were eventually combined (streams 10, 20, and 23) and disposed of as part of the MSW. Discarding solid materials is less complex than liquid EoL materials because the solid materials are fully cured and can be discarded as MSW (stream 23).
Given minimal data on the final destination of AM products, we estimated that solid mass flow distribution is allocated similarly to the 2018 MSW management statistics reported by the US EPA, the most recently available data.57 Composting and food-specific disposal processes were excluded from consideration in the case of AM EoL materials. Recycling, incineration, and landfilling of solid EoL materials were normalized to 23.6, 11.8, and 50%, respectively, which is the basis for the mass flow distribution.32 Ferrous metals may be recovered through magnetic separation postcombustion. However, the recovery of nonferrous metals remains uncertain due to low data availability in public reports.58,59 The remaining incinerator ash and incombustible inorganic materials exiting incineration are sent to landfilling (stream 32) for final disposal.
The material flow analysis supplies a high-level material distribution regarding AM EoL material management, emphasizing EoL material generation rate, solvent use as processing aids, disposal and treatment options based on material properties, possible convergence to conventional MSW management, and environmental releases. Figure 2 shows a visualization of the relative mass flow intensity, which can aid with identifying EoL material processing stages that can affect the highest number of workers. Most mass flows (58% of total EoL material input) are successfully incinerated in the EoL of AM due to the presence of hazardous materials and contaminated solvents entering EoL material management. Recoverable EoL materials are recycled (9% of total EoL material input) as part of the MSW recycling infrastructure, while unrecoverable and incombustible EoL materials are sent to landfilling (33% of total EoL material input). The mass basis of 10.44 million kg EoL materials from AM was normalized to 1 kg to illustrate the relative material flow allocation per unit mass of EoL material input. Up to 0.11 kg of volatile organic compounds (VOCs), fly ash, and landfill gas can be released into the air, while 0.14 kg of EoL materials (litter, leachate, and materials lost during transport) can be released into the surrounding land and water per kilogram of EoL material input. It is essential to highlight that landfill gas and leachate generation rates pose high uncertainties. This statement is also applicable to other AM EoL materials, such as plastics, because they can fragment and persist in the environment for centuries.60,61
Figure 2.
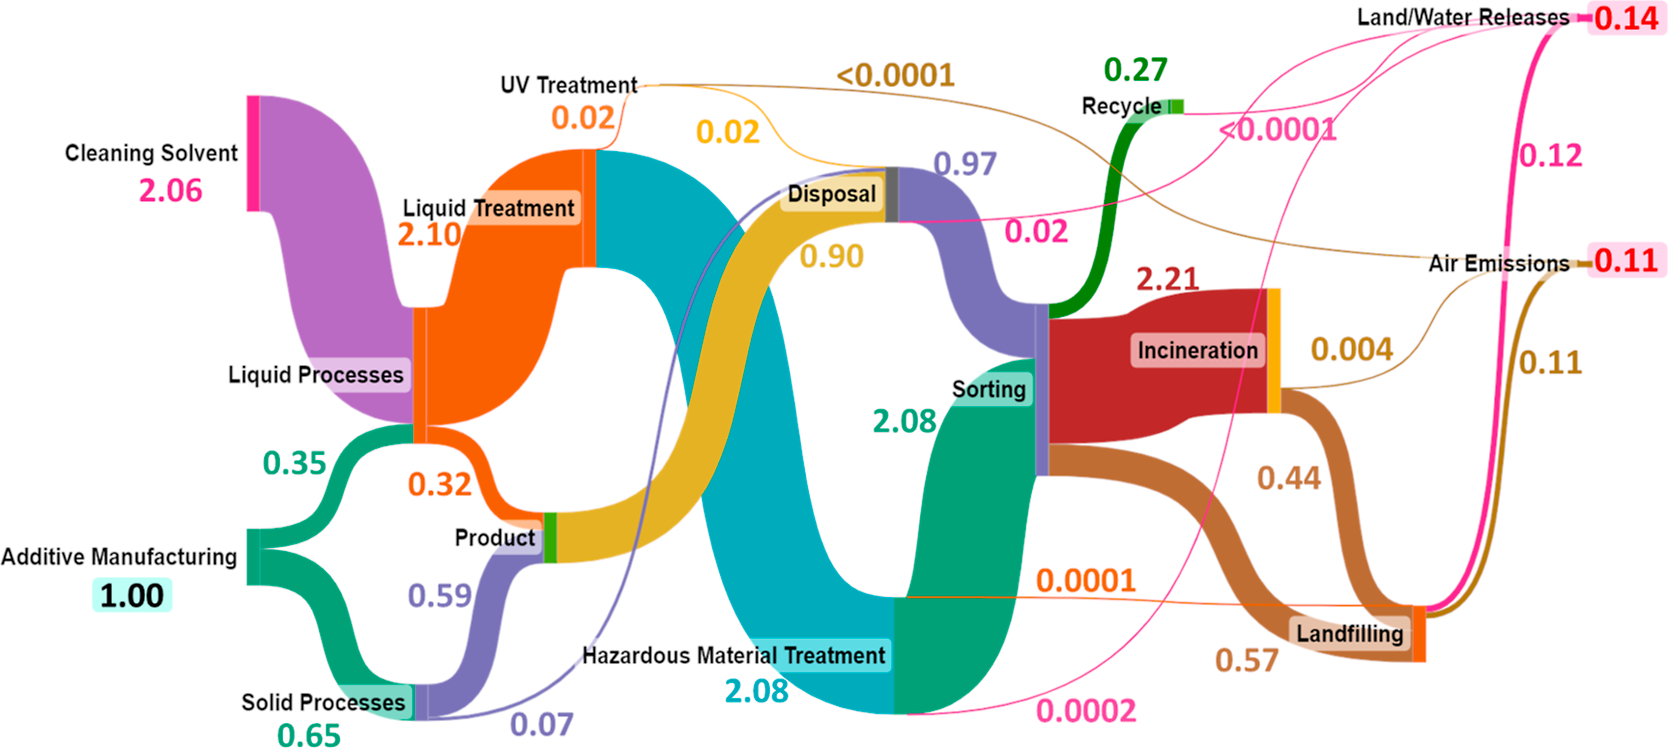
Illustration of the relative mass flow intensity throughout the end-of-life material management stage of AM.
3.2. Generic Exposure Analysis of AM End-of-Life Materials Management.
AM EoL materials may be generated during printing operations, including container residues, cleaning losses and releases, expired materials, and chemical and mechanical finishing effluents. The impacts of releasing these AM EoL materials depend highly on the process types, materials used, and disposal routes, which create a higher risk mitigation complexity when compared to managing MSW. Therefore, the potential mass flow allocation described in Section 3.1 was used to estimate the expected material releases and the potential exposures at a generic EoL management facility.15 This analysis began with managing AM EoL materials (disposal and potential treatment), and the materials would later combine with broader EoL management techniques like recycling, incineration, and landfilling. In most cases where material transfer and transport are required, a spillage rate of 1% was selected, and these materials are fated to become litter that may accumulate on land and water sources.41 Specific AM EoL operations may release other substances beyond spillage, such as air emissions. In addition to the release potential, worst-case occupational exposures were estimated based on the activity and material types processed. The specific descriptions of release and potential exposure findings are described in Sections 3.2.1–3.2.5. Table 3 summarizes the effects of EoL material management activities from AM practices on the surrounding environment, communities, and EoL workers. The material releases highlighted scales directly with the total amount of materials processed calculated from the material flow analysis. Conversely, the occupational exposure rate can vary between facilities, and the total health impact depends on the frequency of incident occurrence and the number of active facilities. It should also be noted that these releases and occupational exposure estimations are intended to be the worst-case scenario in the AM EoL stages. All values were provided as a range to illustrate the uncertainties associated with each operation. Deviation from the reported estimation can be expected depending on the presence of emission control devices, material safety protocol, types of materials processed, and the surrounding environment. This detailed insight facilitates more precise and efficient risk management strategies, considering the distinct properties and potential hazards associated with AM EoL materials.
Table 3.
Generic Exposure Estimation Summary of the AM End-of-Life Material Management. All Releases Are Tabulated Based on the Total Mass Input to the End-of-Life Material Management
| end-of-life activities |
releases (kg/kg input) |
inhalation exposure (mg/day/operator) |
dermal exposure (mg/day/operator) |
|
|---|---|---|---|---|
| air | land/water | |||
| solid disposal | negligible | 0–3.1 × 10⁻³ | 2.0 × 10⁻¹ – 1.3 × 100 | 1.4 × 10² – 2.9 × 10² |
| liquid disposal | negligible | negligible | 1.0 × 10⁻¹ – 3.8 × 10² | 7.1 × 10² – 2.1 × 10³ |
| postdisposal treatment | 0–3.6 × 10⁻⁸ | negligible | negligible | negligible |
| transportation | negligible | 0–3.1 × 10⁻³ | negligible | negligible |
| incineration | ||||
| solid materials | negligible | 0–7.2 × 10⁻³ | negligible | negligible |
| fly ash | 1.1 × 10⁻⁴ – 1.1 × 10⁻³ | 0–2.2 × 10⁻⁴ | 0–1.5 × 10² | 0–5.0 × 10³ |
| bottom ash | negligible | 0−1.2 × 10⁻³ | 0–1.5 × 10² | 0–5.0 × 10³ |
| material recycling | ||||
| plastic | negligible | 0–1.3 × 10⁻³ | 7.5 × 10⁻² – 1.1 × 10² | 1.6 × 100 – 2.2 × 10³ |
| glass | 1.8 × 10⁻⁶ – 5.5 × 10⁻⁵ | 0−1.8 × 10⁻⁴ | 0–1.8 × 100 | 1.4 × 10² – 2.9 × 10² |
| metal | 1.0 × 10⁻⁸ – 1.0 × 10⁻⁴ | 0–5.0 × 10⁻⁴ | 5.5 × 10⁻⁶ – 7.8 × 10⁻⁴ | 1.4 × 10² – 2.9 × 10² |
| landfilling | ||||
| solid materials | negligible | 0–3.3 × 10⁻² | negligible | negligible |
| leachate | negligible | 2.3 × 10⁻⁴ – 1.3 × 10⁻³ | negligible | 7.5 × 10² – 2.3 × 10³ |
| landfill gas | 3.6 × 10⁻³ – 1.4 × 10⁻² | negligible | 1.1 × 101 – 7.2 × 10⁴ | negligible |
3.2.1. Disposal.
Nonhazardous AM EoL materials from Table 1 may be allocated for disposal within MSW and mixed with other EoL materials, while hazardous materials can be sent for treatment in compliance with existing hazardous EoL material management regulations.62 These materials can contribute toward littering and other releases based on various processes during EoL material loading, collection, and transportation to EoL management facilities. At the disposal stage of liquid printing processes, UV-curable resins are often discarded when the resin is contaminated or considered unsuitable for use at the end of its shelf life. Following material disposal, specialized hazardous EoL material transportation is unlikely to contribute meaningfully toward littering because EoL material containers are packaged and sealed for treatment and disposal. Improper disposal of toxic photocurable resins without proper personal protective equipment (PPE) may cause skin irritation or allergic reactions, depending on the resin formulation. The estimated dermal exposure without proper PPE () may thus range between 712 and 2135 mg/day/operator and 139 and 290 mg/day/operator for disposing of liquid and solid AM process EoL material, respectively.
In addition, a small fraction of the resin may contain volatile substances used during the initial formulation, leading to potential inhalation exposure during disposal (), as shown in eq 2.37 The volatile components room concentration, , ranges between 0.01 and 40 mg/m3.45 Most organic components within liquid AM resins are volatile. Except for nonvolatile fillers (5% mass of a generic liquid resin), the value of has been estimated as 0.95. thus equates to 0.10–380 mg/day/operator in the liquid disposal process. The Toxic Substance Control Act (TSCA) grants the EPA regulatory authority over chemical usage in the workplace, including occupational exposures. OSHA has set permissible exposure limits (PELs) for VOCs, while EPA uses its authority under TSCA to ensure sufficient workplace protection and minimize workplace exposures.63 The established OSHA PEL for VOCs in the air for an 8 h time-weighted average (TWA) exposure ranges between 0.002 and 750 mg/m3, setting the inhalation exposure limit to 0.02–7125 mg/day maximum for VOCs.64 With sufficient ventilation, the exposure values can be reduced below OSHA PEL to minimize the chance of health complications associated with the VOCs generated from handling liquid EoL materials.
The inhalation exposure potential for solid-based processes can occur when feedstock powders and filaments are used in an area with minimal ventilation.65 VOC concentrations of 0.02–0.13 mg/m3 () have been reported from solid material processing.46 Therefore, may range from 0.2 to 1.3 mg/day/operator for solid disposal. OSHA PEL for unregulated particles is defaulted to 15 mg/m3, resulting in an exposure limit of 30 mg/day.66 Solid material disposal is safer than liquid disposal, which has a more extensive range of PEL due to variations in VOC toxicity. However, sufficient ventilation and respiratory safeguards should be used to reduce particulate inhalation and the chance of solid accumulation in the lungs. Following material disposal, specialized hazardous EoL material transportation is unlikely to contribute meaningfully toward littering because EoL material containers are packaged and sealed for treatment and disposal.
3.2.2. Postdisposal Hazardous Material Treatment.
Liquid EoL material can be treated through UV and hazardous EoL material treatment, depending on the properties of the discarded materials. Cleaning solvents like isopropanol may constitute much of the final EoL material volume. AM facilities can recover some cleaning solvents through a two-step process involving UV treatment and solid–liquid filtration. UV treatment is employed by placing photocurable resins in a labeled, transparent, resin-safe container and leaving them to cure under sunlight for 1–10 days.52 Other UV treatment methods may also include directly exposing the materials to sunlight without containment, using a UV lamp, or submerging printed parts in water with a UV source. The lack of containment for uncured and partially cured photocurable resins can release VOCs on the outer layer of the printed parts. The solidified materials may be filtered, recovering cleaning solvents of varying purity. The release rate of VOCs may range from 0.07 to 3.24 μg VOCs/cm2/min at 25 °C.3 Up to 1.14 kg/yr of volatile materials can be emitted annually with continuous operation to the surrounding air.
Untreated liquid organic EoL materials may become hazardous when cleaning solvents are heavily contaminated. Various treatment options are available to address this issue, including chemical, thermal, biological, and physical methods. Inorganic materials such as fillers may be separated through a physical separation due to their immiscibility with organic solvents and resins. Thermal treatment is the most used method for reducing the quantity of hazardous EoL material because it can reduce the toxicity of organic materials and generate air pollution. Hazardous EoL materials may also be temporarily stored through surface impoundments until they can be appropriately managed.6 To reduce unintentional environmental releases, these containment sites incorporate other preventive measures, such as leachate collection and removal systems, leak detection mechanisms, and double-liner systems. Alternatively, ocean dumping of hazardous EoL material is prohibited under the Marine Protection, Research and Sanctuaries Act (MPRSA), but this event may still occur illegally.6 Due to the lack of statistical estimates, ocean dumping was assumed to be negligible. Alternatively, incineration is widely adopted for managing hazardous EoL materials, including solvents, resins, scraps, and discarded products.
3.2.3. Incineration of End-of-Life AM Materials.
The incineration of EoL materials can reduce material volume at the expense of generating airborne pollution. The remaining EoL materials are fed into a chamber with oxygen present for combustion. Solid EoL materials, especially organic materials, would thermally decompose at 600–650 °C. For liquid EoL materials, atomization is used during feeding to improve mixing with combustion gas, followed by ignition at temperatures of 700–1650 °C.67 The incinerated mass of EoL materials contributed by AM practices may produce up to 680,000 kg of fly ash and 3.9 million kg of bottom ash annually. These ashes may contain heavy metals and other inorganic materials, which can be sent to landfill or released into the environment.68,69 Depending on the pollution control technology, fly ash emissions may range from 3400 to 34,000 kg/yr, potentially containing dioxins, furans, acid gases, lead, mercury, and VOCs.35,36,70 The mode of exposure for dermal and inhalation is most likely during incinerator maintenance, cleaning, and ash removal. Dermal exposure () can reach up to 5000 mg/day/operator when handling areas with high concentrations of incinerator ash.15,42 Without PPE, inhalation exposure () may reach up to 150 mg ash/day/operator.
3.2.4. Recycling of End-of-Life AM Materials.
The AM practices synergistically integrate with the plastic, glass, metal, ceramics, and composite industries, forming an integral part of the manufacturing process. As a result, the solid AM EoL materials are generally mixed with other MSW and recyclables, creating uncertainties in tracking specific materials. While solid AM materials are not generally recycled, one can estimate amounts of plastic, metals, and glass that could be recycled. For estimation, the mass distribution of recyclable materials from the AM practices was scaled in Table 4 according to the EPA recycled MSW data for 2018.32 Wood, rubber, leather, textiles, inorganic materials, yard trimmings, food, and paper were removed from the final scaled values because they do not compose a considerable portion of the raw materials used in manufacturing compared to plastics, metals, and glass. This scaling does not factor in other materials beyond plastics, metals, and glass; the fixed ratio between these three materials was used to approximate the total AM EoL materials recycled. Materials originating from solid-based printing processes may be suitable for recycling if these materials are sorted with minimal contamination. Various recycling options may be possible because many materials are in the recycling stream. Solid scraps and discarded feedstocks may exist as filaments, wires, pellets, or powders.71–75 However, liquid EoL materials are excluded from recycling because they are managed separately as hazardous materials.
Table 4.
MSW Recycled in 2018 Scaled to Reflect the Contribution from AM Practices32
| materials | percentage of msw recycled (%) | scaled percentage of msw recycled contributed by additive manufacturing practices (%) | materials sent to recycling (kg/yr) [2.78 million kg/yr basis] |
|---|---|---|---|
| plastic | 4.5 | 20.9 | 581,000 |
| wood | 4.5 | 0 | 0 |
| metal | 12.6 | 58.6 | 1,629,000 |
| glass | 4.4 | 20.5 | 570,000 |
| rubber, leather, textiles | 6.1 | 0 | 0 |
| inorganic wastes | 1.4 | 0 | 0 |
| yard trimmings | 0 | 0 | 0 |
| food | 0 | 0 | 0 |
| paper and paperboard | 66.5 | 0 | 0 |
The recycling methods are expected to differ based on materials and the form of the discarded materials. Cruz Sanchez et al. (2020) proposed a multistage closed-loop recycling framework for recycling EoL plastics from AM practices, where postconsumer plastics are theoretically subjected to six recycling phases (recovery, preparation, compounding, feedstock, printing, and quality).71 The physical process for recycling materials may include a plastic extruder and pelletizer. In some instances, the recycled materials may be blended with virgin materials to reduce resource consumption in feedstock preparation.71
Plastics are not hazardous as a standalone material, but the chemical additives within plastics can pose a problem when subjected to mechanical recycling. Recycled materials tend to have a higher concentration of plastic chemical additives.76 In addition, when subjected to physical recycling, such as extrusion, many of the chemical additives and plastics can degrade into monomers, VOCs, and other hazardous materials because the temperature of the material often reaches melting temperature, which can exceed the degradation point of other components.12,77,78 Chea et al. (2023) previously estimated the inhalation exposure potential () from the mechanical recycling of EoL plastics to be 0.075–10 mg particles/day and dermal exposure potential () of 1.6–2170 mg particles/day.15 The released plastics have up to 0.05–70% weight of chemical additives, solvents, and monomers. Many of these chemicals are classified as human and environmental hazards under TSCA and may migrate to the surrounding environment over time.15,78–80 The plastic release contribution from AM practices thus may reach up to 42,000 kg/yr, including the potential spills during the transportation and unloading of EoL plastics.
Metal recycling is typically handled based on physical properties.14 Metal powders are susceptible to distortion, sintering, and, in some cases, oxygen pickup. The oxygen concentration of recycled metal powders often requires mixing with pure powders, similar to the application of recycled plastics.81 Fine metal powders may be present in the surrounding air during operation.72 Multiple modes of occupational exposure can be expected from metal recycling. Often, metal dust can accumulate on equipment surfaces and the skin and clothing of workers. Metal recycling dermal exposure () may reach 139–290 mg/day/operator if the dermal exposure area still is at 1070 cm2. This dermal exposure source can spread through physical contact with other personnel. Metal particles may also be inhaled into the lungs through routine equipment maintenance and cleaning.13 Han et al. (2020) investigated the effects of emissions from metal recycling facilities in the nearby neighborhood. They determined that iron, manganese, nickel, and lead were emitted from the recycling operation at concentrations above the lower limits of quantification (LOQ) at 77.8, 1.12, 2.51, and 0.81 ng/m3, respectively.47 Several other metals were detected below the LOQ, including arsenic, silver, cadmium, cobalt, and selenium. To estimate inhalation exposure () from metal recycling operations, from eq 2 was set to range from 0.55 to 77.8 ng/m3.82 It should be noted that this range is an underestimation because it accounts for the potential concentration of a generic aerosolized metal found in metal recycling. When the mass of airborne metal particles is combined, the total metal concentration may be higher. Holding the time of exposure and breathing rate constant, 5.5–778 ng/day (5.5 × 10⁻⁶–7.8 × 10⁻⁴ mg/day) of metals may be inhaled by EoL metal recycling workers.
Glass particles, fibers, filaments, and scraps contributed by AM practices may have varying management pathways in the EoL stage, depending on the methodology used during manufacturing.9 In some cases, glass fibers can be used as reinforcing materials in composite manufacturing.83 Alternatively, glass-based materials are sorted manually and sent to cullet processors, which can be cleaned and crushed into the cullet. Releases through the air are expected to occur during the glass melting operation.84 Without emission control devices, 0.0001–0.0031 kg of air contaminants, including small particles, sulfur oxides, nitrogen oxides, organic matter, and carbon monoxide, can be released per kilogram of glass processed. Occupational exposure to inhalable particulate matter for indoor glass recycling operations can reach up to 0.18 mg/m3.11 By applying eq 2, a typical worker at a glass cullet processing facility may be exposed to 1.8 mg/day () without a respirator. The glass dust may accumulate inside the lung and cause progressive and permanent damage to the lung tissues, creating breathing problems.85 Dermal exposure is unlikely to create issues because glass remains stable with no known reaction to human skin.86 Nevertheless, mechanical irritation may occur depending on how the skin encounters glass fragments and shards.
Composite materials are typically incinerated and landfilled because the composition consists of heterogeneous materials from Table 1, making separation challenging in the existing MSW recycling paradigm.87 Therefore, this exposure analysis excludes EoL exposure from handling composite-based materials. EoL ceramics from AM and common MSW are not recyclable and are sent to landfilling.
3.2.5. Landfilling of End-of-Life AM Materials.
Landfilling is a widely used method for managing solid EoL materials unsuitable for recycling or incineration.38,88 This section of the discussion pertains to MSW landfills. In daily landfill operations, EoL materials, including solid scraps, prototypes, postconsumer printed products, and discarded feedstock materials, are typically subjected to tipping, compacting, and covering. These materials are often combined with contaminants, including plastic additives, solvents, phenols, heavy metals, xenobiotic organic compounds, dissolved organic matter, and inorganic components. Since landfills receive diverse materials from multiple industries, some speculation is involved in the landfill analysis. When subjected to the landfill environment, hazardous chemicals may migrate from the material matrix, while micro and nanoparticles can disperse throughout the containment.89 Therefore, these considerations are crucial for understanding the potential environmental and health implications of landfilling practices.
Over time, liquid accumulation within landfills may reach high concentrations of organic impurities, effectively acting as a solvent capable of extracting harmful chemicals from the landfilled EoL materials. Leachate releases become possible over time as the containment surrounding the MSW landfill weakens.38 Several factors, including liner failure, chemical interactions with the liner, leachate diffusion, and the absence of geological barriers, can contribute to landfill leachate releases to soil and groundwater supplies.90
The leachate release rate has been estimated to be approximately 0.1–2% of the carbon input based on a series of simulated landfill experiments over 1.5–5 years.34,91 These experimental findings equate to a 0.07–0.4% annual release rate and are assumed applicable to landfill mass inputs, irrespective of the carbon content in the AM EoL materials, assuming a linear release profile over time. Landfill leachate releases contributed by the AM practices can thus range from 10,400 to 209,000 kg based on 10.46 million kg of EoL materials entering the landfill. Table S4 reports the maximum concentration profile of known organic hazardous components found in landfill leachate.21 It is essential to note that these chemicals may not exclusively originate from the AM EoL materials, as landfills receive a mix of material types. Moreover, not all materials can degrade at the same rate as other MSW (e.g., food, paper, and garden waste), increasing the uncertainties regarding byproducts directly contributed by AM. The potential dermal exposure () for each landfill worker can reach 750–2250 mg leachate/day without PPE. Although the calculated daily exposure of leachate-to-skin contact may be high, the exposure to chemicals of concern within leachate is considerably smaller (10−9 to 10−5 mg/day).
Landfill workers may face potential inhalation exposure potentials because of the continuous generation of landfill gases, including methane, ammonia, hydrogen sulfide, and nonmethane organic carbon.92 Exposure to these gases can create an oxygen-deficient environment, leading to asphyxiation risks for workers. Similar to leachate estimation, these landfill gases are not exclusively attributed to AM EoL materials but are influenced by other materials present in the landfill.60 Table S5 reports the maximum concentration and inhalation exposure rate (), and thus, each landfill operator may experience up to 72,000 mg of landfill gas per day in the worst-case scenario.21 Like the case of leachate generation, the landfill gas chemical content is not necessarily generated from AM EoL materials. Instead, this generation is derived from the AM EoL materials being disposed of as a mixture with other MSW. Occasionally, the landfill gas concentration exceeds the recommended threshold limit values for TWA and short-term exposure.
Since 2001, landfills have been subjected to stringent design and operation measures such as improved liner systems, continuous groundwater monitoring, and postclosure care.93 Specifically, landfills may not be placed in environmentally sensitive areas, in addition to having an on-site environmental monitoring system to monitor groundwater contamination and landfill gas generation continuously. These components are required to ensure compliance with federal regulations.94
3.3. Addressing Environmental and Health Impacts in AM End-of-Life Material Management.
This research tracked the material allocation and quantified the occupational health and safety issues within the AM EoL management practices, examining mass flow intensity, material releases, and worker exposure, emphasizing the need for process improvements to minimize environmental and occupational hazards. Generally, AM practices can produce more accurate and complex parts, resulting in higher material use efficiency and lower energy consumption than conventional manufacturing processes. However, it is crucial to recognize persistent challenges within AM practices, particularly concerning the release of toxic material and the potential exposure of workers to hazardous substances during the EoL management stages. The AM EoL material management challenges and remarks on potential solutions are summarized as follows:
It is estimated that approximately 9% of the total AM EoL materials are successfully recycled. The low recyclability value is caused by the existing MSW management system and the inherent toxicity of materials derived from liquid AM processes. Nonhazardous solid scraps, prototypes, and failed prints lead to inefficient use of materials, with up to 33% of the total AM EoL materials sent to landfills despite the inherent recyclability with several material types, namely, polymers, metals, and glass. These materials can pose environmental and health impacts if not properly managed. Increasing the AM EoL material recycling rate requires better material feedstock selection during manufacturing, which would account for renewability, processability, and potential reuse across multiple life cycles.
Equipment and print cleaning may require aid from chemical solvents, and these cleaning EoL materials may enter POTWs as toxic pollutants, negatively affecting wastewater treatment facilities. AM operations (industrial/commercial, research and development, service bureaus, and consumer) can mismanage postmanufacturing EoL materials due to accidents, lack and misinterpretation of disposal guidelines, ease of access to drainage systems, and pressure to expedite cleaning processes. The impact of the pollutants on POTWs should be further investigated and quantified.
Hazardous AM EoL materials are difficult to separate and purify, leading to environmental burdens. Incineration and specialized landfills are often considered as a solution. Addressing the complexity of separating and purifying hazardous AM EoL materials should begin with a recycling code model based on the resin identification code postmanufacturing to streamline the identification process for hazardous components.95 Investing in separation and purification guidelines for AM EoL materials, such as advanced filtration or chemical separation, holds promise for efficiently extracting hazardous components, thereby mitigating environmental burdens associated with EoL material handling.
Individual operators may not have the equipment to recover feedstocks reliably, although it is possible to implement an internal recovery scheme within the manufacturing stage. However, it is worth investigating the effects of adding such a recovery loop, namely, solvent recovery and filament extruder, and analyzing the net cost to incentivize recycling efforts. At a minimum, in-house collection, sorting, and scrap reprocessing can minimize the need for material disposal.96,97
EoL material management challenges can be expected to begin at the generation point and propagate as these materials are transported to the EoL material management stage. The identity and purity level of these materials can also become lost, creating a disconnection between manufacturing and EoL material management. Manufacturers have the most information regarding the materials used to create each product. A transparent system of communications between the manufacturer, consumer, and EoL material management would support better material management and handling from a life cycle perspective. These communications may include creating a publicly available database of potential substances within the manufactured materials, drafting spill response plans for hazardous materials, and implementing more stringent quality control measures to find and prevent spills or material losses throughout the life cycle of manufactured materials. Consequently, the frequency of the release events shown in Table 3 can be reduced. Material substitution may also prove helpful in minimizing the impact of material releases if manufacturers use more sustainable and environmentally benign materials, provided sufficiently useful information (e.g., toxicological, environmental fate, and exposure limits) is available.
Exposure assessments revealed notable occupational exposure levels during the disposal and recycling of AM EoL materials. Solid EoL disposal processes generally entail fewer volatile substances in the working environment than liquid disposal methods, which often involve photopolymer resins, solvents, and specific chemical additives. Incineration and landfilling exhibit higher potential for exposure, yet these processes handle EoL materials from various industries, potentially affecting exposure data accuracy. Our estimations underscore the critical need for proper ventilation and PPE to mitigate inhalation and dermal contact with hazardous airborne particles. Although our assessment primarily considered hand-based exposure, we acknowledge the possibility of facial and ocular dermal exposure during material volatilization, although less frequent. These exposures primarily stem from releases during EoL material management, encompassing resin volatiles, plastics, heavy metals, incinerator ashes, and leachates. Selecting appropriate feedstocks in AM practices is crucial in averting unwanted releases and worker and environmental exposure. Without knowledge of upstream feedstocks and treatment processes, EoL management personnel should consistently employ proper PPE, monitor material releases, and ensure adequate ventilation to diminish volatile substance concentrations. These substances could lead to severe long-term health effects, bioaccumulation, and environmental contamination if unmitigated.
The sustainability implications of EoL treatment for discarded materials from AM practices remain uncertain. Therefore, a comprehensive process sustainability assessment can prove beneficial in conjunction with the generic exposure assessment to address this uncertainty and further enhance the overall EoL material management process. This assessment should encompass process efficiency, energy consumption, economic viability, and environmental impact. This comprehensive approach can help identify specific problems within the life cycle of AM materials from multiple perspectives, suggest EoL material and occupational exposure reduction opportunities, and promote more sustainable resource utilization.
Supplementary Material
ACKNOWLEDGMENTS
This research was supported by the appointment of J.D.C. to the Research Participation Program at the Center for Environmental Solutions and Emergency Response, Office of Research and Development, US EPA, administered by the Oak Ridge Institute for Science and Education through an Interagency Agreement between the US Department of Energy and the US EPA. The authors express their sincere gratitude and appreciation to Priscilla Halloran of the EPA’s Office of Resource Conservation and Recovery for her critical review of draft versions of our manuscript, recommendations, and insightful discussions.
ABBREVIATIONS
- AM
additive manufacturing
- EoL
end-of-life
- EPA
Environmental Protection Agency
- MSW
municipal solid waste
- NAICS
North American Industry Classification System
- OSHA
Occupational Safety and Health Administration
- PEL
permissible exposure limits
- POTW
Publicly Owned Treatment Works
- PPE
personal protective equipment
- RCRAInfo
Resource Conservation and Recovery Act Information
- TRI
Toxics Release Inventory
- TSCA
Toxic Substances Control Act
- US
United States
- UV
Ultraviolet
- VOC
volatile organic compound
Footnotes
The authors declare no competing financial interest.
The views contained in this document are those of the authors and should not be interpreted as representing the official policies, either expressed or implied, of the US EPA or the US government. Any mention of trade names, products, or services does not imply an endorsement by the US Government or the US EPA. The US EPA does not endorse any commercial products, services, or enterprises.
ASSOCIATED CONTENT
Supporting Information
The Supporting Information is available free of charge at https://pubs.acs.org/doi/10.1021/acs.est.4c01562.
Additional information regarding the potential materials entering end-of-life material management contributed by AM practices, parameters used and assumptions made for the material flow analysis, mass flow rate by stream, and chemicals of concern list that may be involved in dermal and inhalation exposure. The spreadsheet used for calculating the feed basis and the material flow analysis of end-of-life materials from AM: https://github.com/cheajohn/Generic_Exposure_Assessment_EoL_AdditiveManufacturing (PDF)
Contributor Information
John D. Chea, Oak Ridge Institute for Science and Education, Hosted by Office of Research & Development, US Environmental Protection Agency, Cincinnati, Ohio 45268, United States
Gerardo J. Ruiz-Mercado, Office of Research & Development, US Environmental Protection Agency, Cincinnati, Ohio 45268, United States; Chemical Engineering Graduate Program, Universidad del Atlántico, Puerto Colombia 080007, Colombia
Raymond L. Smith, Office of Research & Development, US Environmental Protection Agency, Cincinnati, Ohio 45268, United States
David E. Meyer, Office of Research & Development, US Environmental Protection Agency, Cincinnati, Ohio 45268, United States
Michael A. Gonzalez, Office of Research & Development, US Environmental Protection Agency, Cincinnati, Ohio 45268, United States
William M. Barrett, Office of Research & Development, US Environmental Protection Agency, Cincinnati, Ohio 45268, United States
REFERENCES
- (1).Dobrzyńska E; Kondej D; Kowalska J; Szewczyńska M State of the Art in Additive Manufacturing and Its Possible Chemical and Particle Hazards-Review. Indoor Air 2021, 31 (6), 1733–1758. [DOI] [PMC free article] [PubMed] [Google Scholar]
- (2).Zisook RE; Simmons BD; Vater M; Perez A; Donovan EP; Paustenbach DJ; Cyrs WD Emissions Associated with Operations of Four Different Additive Manufacturing or 3D Printing Technologies. J. Occup. Environ. Hyg. 2020, 17 (10), 464–479. [DOI] [PubMed] [Google Scholar]
- (3).Pham YL; Wojnowski W; Beauchamp J Volatile Compound Emissions from Stereolithography Three-Dimensional Printed Cured Resin Models for Biomedical Applications. Chem. Res. Toxicol. 2022, 36, 369–379. [DOI] [PubMed] [Google Scholar]
- (4).Zhang Q; Davis AY; Black MS Emissions and Chemical Exposure Potentials from Stereolithography Vat Polymerization 3D Printing and Post-Processing Units. ACS Chem. Health Saf. 2022, 29 (2), 184–191. [Google Scholar]
- (5).Byrley P; Geer Wallace MA; Boyes WK; Rogers K Particle and Volatile Organic Compound Emissions from a 3D Printer Filament Extruder. Sci. Total Environ. 2020, 736, 139604. [DOI] [PMC free article] [PubMed] [Google Scholar]
- (6).US, EPA. Hazardous Waste Management Facilities and Units. https://www.epa.gov/hwpermitting/hazardous-waste-management-facilities-and-units (accessed Feb 12, 2023).
- (7).Ngo TD; Kashani A; Imbalzano G; Nguyen KTQ; Hui D Additive Manufacturing (3D Printing): A Review of Materials, Methods, Applications and Challenges. Composites, Part B 2018, 143, 172–196. [Google Scholar]
- (8).Pagac M; Hajnys J; Ma Q-P; Jancar L; Jansa J; Stefek P; Mesicek J A Review of Vat Photopolymerization Technology: Materials, Applications, Challenges, and Future Trends of 3D Printing. Polymers 2021, 13 (4), 598. [DOI] [PMC free article] [PubMed] [Google Scholar]
- (9).Xin C; Li Z; Hao L; Li Y A Comprehensive Review on Additive Manufacturing of Glass: Recent Progress and Future Outlook. Mater. Des. 2023, 227, 111736. [Google Scholar]
- (10).Cioca L; Ferronato N; Viotti P; Magaril E; Ragazzi M; Torretta V; Rada E Risk Assessment in a Materials Recycling Facility: Perspectives for Reducing Operational Issues. Resources 2018, 7 (4), 85. [Google Scholar]
- (11).Kennedy SM Point-of-Sale Glass Bottle Recycling: Indoor Airborne Exposures and Symptoms among Employees. Occup. Environ. Med. 2004, 61 (7), 628–635. [DOI] [PMC free article] [PubMed] [Google Scholar]
- (12).Hopewell J; Dvorak R; Kosior E Plastics Recycling: Challenges and Opportunities. Philos. Trans. R. Soc., B 2009, 364 (1526), 2115–2126. [DOI] [PMC free article] [PubMed] [Google Scholar]
- (13).Washington State Department of Labor & Industries. Preventing Lead Poisoning in Scrap Metal Recycling - An Alert for Workers and Employers, 2016. https://lni.wa.gov/forms-publications/F310-008-000.pdf (accessed Mar 08, 2023).
- (14).Yang Y; Zhao F Closing the Material Loop in Additive Manufacturing: A Literature Review on Waste Recycling. IOP Conf. Ser.: Mater. Sci. Eng. 2021, 1196 (1), 012008. [Google Scholar]
- (15).Chea JD; Yenkie KM; Stanzione JF; Ruiz-Mercado GJ; Ruiz-Mercado GJ A Generic Scenario Analysis of End-of-Life Plastic Management: Chemical Additives. J. Hazard. Mater. 2023, 441, 129902. [DOI] [PMC free article] [PubMed] [Google Scholar]
- (16).Song R; Telenko C Material Waste of Commercial FDM Printers under Realstic Conditions. In Solid Freeform Fabrication 2016: Proceedings of the 26th Annual International Solid Freeform Fabrication Symposium – An Additive Manufacturing Conference; 2016. [Google Scholar]
- (17).Smith RL; Takkellapati S; Riegerix RC Recycling of Plastics in the United States: Plastic Material Flows and Polyethylene Terephthalate (PET) Recycling Processes. ACS Sustainable Chem. Eng. 2022, 10 (6), 2084–2096. [DOI] [PMC free article] [PubMed] [Google Scholar]
- (18).US, EPA. Toxics Release Inventory (TRI) Program - Basics of TRI Reporting. https://www.epa.gov/toxics-release-inventory-triprogram/basics-tri-reporting (accessed July 13, 2023).
- (19).US, EPA. RCRAInfo. https://rcrainfo.epa.gov/rcrainfo-help/application/index.htm#t=Introduction.htm (accessed July 13, 2023).
- (20).Krechmer JE; Phillips B; Chaloux N; Shomberg R; Daube C; Manchanda G; Murray S; McCarthy A; Fonseca R; Thakkar J; Loose B; Herndon SC; Jayne JT; Worsnop DR; Canagaratna MR Chemical Emissions from Cured and Uncured 3D-Printed Ventilator Patient Circuit Medical Parts. ACS Omega 2021, 6 (45), 30726–30733. [DOI] [PMC free article] [PubMed] [Google Scholar]
- (21).Polvara E; Essna ashari B; Capelli L; Sironi S Evaluation of Occupational Exposure Risk for Employees Working in Dynamic Olfactometry: Focus On Non-Carcinogenic Effects Correlated with Exposure to Landfill Emissions. Atmosphere 2021, 12 (10), 1325. [Google Scholar]
- (22).Formlabs. Best Practices for Washing Prints. https://support.formlabs.com/s/article/Washing-Prints?language=en_US (accessed Feb 13, 2023).
- (23).Toor R 3D Printing Waste Problem. https://www.filamentive.com/the-3d-printing-waste-problem/(accessed Feb 01, 2023).
- (24).El-Haggar SM Sustainability of Municipal Solid Waste Management. In Sustainable Industrial Design and Waste Management, 2007; pp 149–196.. [Google Scholar]
- (25).Green J America’s Garage Hobbyists Fight the Pandemic with 3D Printers. https://www.bloomberg.com/news/articles/2020-04-22/america-s-garage-hobbyists-fight-the-pandemic-with-3d-printers (accessed Feb 01, 2023).
- (26).AMFG. The Additive Manufacturing Landscape 2019; AMFG, 2019. [Google Scholar]
- (27).Chen Q DIVERSE APPLICATIONS OF INORGANIC FILLERS IN ADDITIVE MANUFACTURING OF FUNCTIONAL MATERIALS. PhD. Thesis, CASE WESTERN RESERVE UNIVERSITY, 2020. [Google Scholar]
- (28).Dwamena M 3D Print Failures - Why Do They Fail & How Often? https://3dprinterly.com/3d-print-failures-why-do-they-fail-how-often/(accessed Feb 13, 2023).
- (29).Cristaldi A; Fiore M; Zuccarello P; Oliveri Conti G; Grasso A; Nicolosi I; Copat C; Ferrante M Efficiency of Wastewater Treatment Plants (WWTPs) for Microplastic Removal: A Systematic Review. IJERPH 2020, 17 (21), 8014. [DOI] [PMC free article] [PubMed] [Google Scholar]
- (30).Jambeck JR; Geyer R; Wilcox C; Siegler TR; Perryman M; Andrady A; Narayan R; Law KL Plastic Waste Inputs from Land into the Ocean. Science 2015, 347 (6223), 768–771. [DOI] [PubMed] [Google Scholar]
- (31).Law KL; Starr N; Siegler TR; Jambeck JR; Mallos NJ; Leonard GH The United States’ Contribution of Plastic Waste to Land and Ocean. Sci. Adv. 2020, 6 (44), No. eabd0288. [DOI] [PMC free article] [PubMed] [Google Scholar]
- (32).US, EPA Advancing Sustainable Materials Management: 2018 Tables and Figures - Assessing Trends in Materials Generation and Management in the United States; United States Environmental Protection Agency, 2020; p 84. [Google Scholar]
- (33).US, EPA. Energy Recovery from the Combustion of Municipal Solid Waste (MSW). https://www.epa.gov/smm/energy-recovery-combustion-municipal-solid-waste-msw#:~:text=The-amount-of-ash-generated,fly-ash-and-bottom-ash. (accessed Feb 13, 2023).
- (34).Kim HJ; Matsuto T; Tojo Y An Investigation of Carbon Release Rate via Leachate from an Industrial Solid Waste Landfill. Waste Manage. Res. 2011, 29 (6), 612–621. [DOI] [PubMed] [Google Scholar]
- (35).Kurella S; Meikap BC Removal of Fly-Ash and Dust Particulate Matters from Syngas Produced by Gasification of Coal by Using a Multi-Stage Dual-Flow Sieve Plate Wet Scrubber. J. Environ. Sci. Health, Part A 2016, 51 (10), 870–876. [DOI] [PubMed] [Google Scholar]
- (36).Meikap B Fly-Ash Removal Efficiency in a Modified Multi-Stage Bubble Column Scrubber. Sep. Purif. Technol. 2004, 36 (3), 177–190. [Google Scholar]
- (37).US, EPA Exposure Factors Handbook, 2011 Edition; U.S. Environmental Protection Agency: Washington, DC, 2011. [Google Scholar]
- (38).Kjeldsen P; Barlaz MA; Rooker AP; Baun A; Ledin A; Christensen TH Present and Long-Term Composition of MSW Landfill Leachate: A Review. Crit. Rev. Environ. Sci. Technol. 2002, 32 (4), 297–336. [Google Scholar]
- (39).US, EPA. ChemSTEER User Guide - Chemical Screening Tool for Exposures and Environmental Releases, 2015. https://www.epa.gov/sites/default/files/2015-05/documents/user_guide.pdf (accessed Feb 13, 2023).
- (40).US, EPA Exposure Factors Handbook - Chapter 6: Inhalation Rates; US, EPA, 2011. [Google Scholar]
- (41).US, EPA Use of Additive in Plastic Compounding - Generic Scenario for Estimating Occupational Exposures and Environmental Releases (Draft); U.S. Environmental Protection Agency: Washington, DC, 2014. [Google Scholar]
- (42).Tyson S Fly Ash Facts for Highway Engineers, 2017. https://www.fhwa.dot.gov/pavement/recycling/fach01.cfm#:~:text=prevent-dust-emission.-,Characteristics,(Figure-1D2). (accessed Sep 07, 2022).
- (43).Zontek TL; Ogle BR; Jankovic JT; Hollenbeck SM An Exposure Assessment of Desktop 3D Printing. J. Chem. Health Saf. 2017, 24 (2), 15–25. [Google Scholar]
- (44).Wojnowski W; Kalinowska K; Majchrzak T; Zabiegała B Real-Time Monitoring of the Emission of Volatile Organic Compounds from Polylactide 3D Printing Filaments. Sci. Total Environ. 2022, 805, 150181. [DOI] [PubMed] [Google Scholar]
- (45).Bowers LN; Stefaniak AB; Knepp AK; LeBouf RF; Martin SB; Ranpara AC; Burns DA; Virji MA Potential for Exposure to Particles and Gases throughout Vat Photopolymerization Additive Manufacturing Processes. Buildings 2022, 12 (8), 1222. [DOI] [PMC free article] [PubMed] [Google Scholar]
- (46).JensenHarboeBrostrøm ACHA; Jensen KA; Fonseca AS; Jensen KA; Fonseca AS Nanoparticle Exposure and Workplace Measurements During Processes Related to 3D Printing of a Metal Object. Front. Public Health 2020, 8, 608718. [DOI] [PMC free article] [PubMed] [Google Scholar]
- (47).Han I; Richner D; An Han H; Hopkins L; James D; Symanski E Evaluation of Metal Aerosols in Four Communities Adjacent to Metal Recyclers in Houston, Texas, USA. J. Air Waste Manage. Assoc. 2020, 70 (5), 568–579. [DOI] [PMC free article] [PubMed] [Google Scholar]
- (48).Bours J; Adzima B; Gladwin S; Cabral J; Mau S Addressing Hazardous Implications of Additive Manufacturing: Complementing Life Cycle Assessment with a Framework for Evaluating Direct Human Health and Environmental Impacts. J. Ind. Ecol. 2017, 21 (S1), S25–S36. [Google Scholar]
- (49).US, EPA. Toxics Release Inventory (TRI) Program - Reporting for TRI Facilities. https://www.epa.gov/toxics-release-inventory-tri-program/reporting-tri-facilities#:~:text=Each-year-C-certain-industrial-facilities,makes-these-data-publicly-available. (accessed Mar 29, 2024).
- (50).Wohlers T Wohlers Associates. https://wohlersassociates.com/(accessed Feb 01, 2023).
- (51).Jennings A 3D Printing Troubleshooting: All Problems & Solutions. https://all3dp.com/1/common-3d-printing-problems-troubleshooting-3d-printer-issues/(accessed Feb 13, 2023).
- (52).Formlabs. Disposing of Resin. https://support.formlabs.com/s/article/Disposing-of-resin?language=en_US (accessed Feb 13, 2023).
- (53).Hernandez-Betancur JD; Ruiz-Mercado GJ; Abraham JP; Martin M; Ingwersen WW; Smith RL Data Engineering for Tracking Chemicals and Releases at Industrial End-of-Life Activities. J. Hazard. Mater. 2021, 405, 124270. [DOI] [PMC free article] [PubMed] [Google Scholar]
- (54).US, EPA Guide to Treatment Technologies for Hazardous Wastes at Superfund Sites; US, EPA, 1989. [Google Scholar]
- (55).Zorc J; Hall J; Rissetto C Minimizing Liabilities Facing POTWs. J. Water Pollut. Control Fed. 1988, 60, 29–35. [Google Scholar]
- (56).Xu C; Liu R; Zheng W; Lin L; Chen L Removal of AOX in Activated Sludge of Industrial Chemical Dyestuff with Bimetallic Pd/Fe Particles. Water 2021, 13 (11), 1543. [Google Scholar]
- (57).US, EPA. National Overview: Facts and Figures on Materials, Wastes and Recycling. https://www.epa.gov/facts-and-figures-about-materials-waste-and-recycling/national-overview-facts-and-figures-materials (accessed Nov 22, 2023).
- (58).Haupt M; Kägi T; Hellweg S Life Cycle Inventories of Waste Management Processes. Data in Brief 2018, 19, 1441–1457. [DOI] [PMC free article] [PubMed] [Google Scholar]
- (59).Michaels T; Krishnan K Energy Recovery Council 2018 Directory of Waste-to-Energy Facilities; Energy Recovery Council, 2018. [Google Scholar]
- (60).Wojnowska-Baryła I; Bernat K; Zaborowska M Plastic Waste Degradation in Landfill Conditions: The Problem with Microplastics, and Their Direct and Indirect Environmental Effects. IJERPH 2022, 19 (20), 13223. [DOI] [PMC free article] [PubMed] [Google Scholar]
- (61).Turner A; Arnold R; Williams T Weathering and Persistence of Plastic in the Marine Environment: Lessons from LEGO. Environ. Pollut. 2020, 262, 114299. [DOI] [PubMed] [Google Scholar]
- (62).US, EPA. Resource Conservation and Recovery Act (RCRA) Regulations. https://www.epa.gov/rcra/resource-conservation-and-recovery-act-rcra-regulations (accessed Oct 17, 2023).
- (63).US, EPA. Memorandum of Understanding Between The Office of Chemical Safety and Pollution Prevention, 2021. https://www.epa.gov/sites/default/files/2021-01/documents/21-mou-048_osha_and_environmental_protection_agency_epa_-_mou.pdf (accessed Mar 29, 2024).
- (64).OSHA. Permissible Exposure Limits - Annotated Tables, https://www.osha.gov/annotated-pels/table-z-2 (accessed July 05, 2023).
- (65).NIOSH. 3D Printing with Metal Powders: Health and Safety Questions to Ask, 2020. [Google Scholar]
- (66).OSHA. PARTICULATES NOT OTHERWISE REGULATED, TOTAL AND RESPIRABLE DUST (PNOR)†, https://www.osha.gov/chemicaldata/801 (accessed Feb 10, 2023).
- (67).US, EPA. On-Site Incineration: Overview of Superfund Operating Experience; US, EPA, 1998. [Google Scholar]
- (68).Kanhar AH; Chen S; Wang F Incineration Fly Ash and Its Treatment to Possible Utilization: A Review. Energies 2020, 13 (24), 6681. [Google Scholar]
- (69).Goodwin RW Governmental Regulations. In Combustion Ash Residue Management; Elsevier, 2014; pp 9–30.. [Google Scholar]
- (70).National Research Council. Waste Incineration and Public Health; The National Academies Press: Washington, DC, 2000. [PubMed] [Google Scholar]
- (71).Cruz Sanchez FA; Boudaoud H; Camargo M; Pearce JM Plastic Recycling in Additive Manufacturing: A Systematic Literature Review and Opportunities for the Circular Economy. J. Cleaner Prod. 2020, 264, 121602. [Google Scholar]
- (72).Herzog D; Seyda V; Wycisk E; Emmelmann C Additive Manufacturing of Metals. Acta Mater. 2016, 117, 371–392. [Google Scholar]
- (73).Sun J; Ye D; Zou J; Chen X; Wang Y; Yuan J; Liang H; Qu H; Binner J; Bai J A Review on Additive Manufacturing of Ceramic Matrix Composites. J. Mater. Sci. Technol. 2023, 138, 1–16. [Google Scholar]
- (74).Zhang D; Liu X; Qiu J 3D Printing of Glass by Additive Manufacturing Techniques: A Review. Front. Optoelectron. 2021, 14 (3), 263–277. [DOI] [PMC free article] [PubMed] [Google Scholar]
- (75).Chen Z; Li Z; Li J; Liu C; Lao C; Fu Y; Liu C; Li Y; Wang P; He Y 3D Printing of Ceramics: A Review. J. Eur. Ceram. Soc. 2019, 39 (4), 661–687. [Google Scholar]
- (76).Lowe CN; Phillips KA; Favela KA; Yau AY; Wambaugh JF; Sobus JR; Williams AJ; Pfirrman AJ; Isaacs KK Chemical Characterization of Recycled Consumer Products Using Suspect Screening Analysis. Environ. Sci. Technol. 2021, 55 (16), 11375–11387. [DOI] [PMC free article] [PubMed] [Google Scholar]
- (77).Ragaert K; Delva L; Van Geem K Mechanical and Chemical Recycling of Solid Plastic Waste. Waste Manage. 2017, 69, 24–58. [DOI] [PubMed] [Google Scholar]
- (78).Hahladakis JN; Velis CA; Weber R; Iacovidou E; Purnell P An Overview of Chemical Additives Present in Plastics: Migration, Release, Fate and Environmental Impact during Their Use, Disposal and Recycling. J. Hazard. Mater. 2018, 344, 179–199. [DOI] [PubMed] [Google Scholar]
- (79).Groh KJ; Backhaus T; Carney-Almroth B; Geueke B; Inostroza PA; Lennquist A; Leslie HA; Maffini M; Slunge D; Trasande L; Warhurst AM; Muncke J Overview of Known Plastic Packaging-Associated Chemicals and Their Hazards. Sci. Total Environ. 2019, 651, 3253–3268. [DOI] [PubMed] [Google Scholar]
- (80).Hansen E Hazardous Substances in Plastic Materials; COWI-Denmark and Danish Technological Institute, 2013;. [Google Scholar]
- (81).Samant R; Lewis B Metal Powder Recycling and Reconditioning in Additive Manufacturing; EWI, 2017. https://ewi.org/metal-powder-recycling-and-reconditioning-in-additive-manufacturing/(accessed Feb 24, 2023). [Google Scholar]
- (82).Organisation for Economic Cooperation and Development. Emission Scenario Document for Emission of Metals during Primary and Secondary Smelting and Waste Incineration, Covering Recycling of Electrical and Electronic Waste, 2022. https://www.oecd.org/officialdocuments/publicdisplaydocumentpdf/?cote=ENV/CBC/MONO(2022)34&doclanguage=en (accessed Feb 11, 2023).
- (83).R MKH; Benal MGM; Pradeep Kumar GS; Tambrallimath V; H.R G; Khan TMY; Rajhi AA; Baig MAA. Influence of Short Glass Fibre Reinforcement on Mechanical Properties of 3D Printed ABS-Based Polymer Composites. Polymers 2022, 14 (6), 1182. [DOI] [PMC free article] [PubMed] [Google Scholar]
- (84).Gaines LL; Mintz MM Energy Implications of Glass-Container Recycling; ANL/NREL: Argonne, IL/Golden, CO, 1994. [Google Scholar]
- (85).NIOSH. Crystalline Silica - Health Risks of Exposure, https://www.cdc.gov/niosh/topics/silica/risks.html#:~:text=Silica-dust-particles-become-trapped,debilitating-C-and-sometimes-fatal-disease. (accessed Feb 12, 2023).
- (86).IBIX. Recycled Glass Abrasive - Safety Data Sheet, 2015. https://ibixusa.com/wp-content/uploads/2019/02/safety_data_sheet_crushed_glass.pdf (accessed Mar 09, 2023).
- (87).Rybicka J; Tiwari A; Leeke GA Technology Readiness Level Assessment of Composites Recycling Technologies. J. Cleaner Prod. 2016, 112, 1001–1012. [Google Scholar]
- (88).Marttinen SK; Kettunen RH; Rintala JA Occurrence and Removal of Organic Pollutants in Sewages and Landfill Leachates. Sci. Total Environ. 2003, 301 (1–3), 1–12. [DOI] [PubMed] [Google Scholar]
- (89).Kabir MS; Wang H; Luster-Teasley S; Zhang L; Zhao R Microplastics in Landfill Leachate: Sources, Detection, Occurrence, and Removal. Environ. Sci. Ecotechnology 2023, 16, 100256. [DOI] [PMC free article] [PubMed] [Google Scholar]
- (90).Allen A Containment landfills: the myth of sustainability. Eng. Geol. 2001, 60, 3–19. [Google Scholar]
- (91).Valencia R; van der Zon W; Woelders H; Lubberding HJ; Gijzen HJ Achieving “Final Storage Quality” of Municipal Solid Waste in Pilot Scale Bioreactor Landfills. Waste Manage. 2009, 29 (1), 78–85. [DOI] [PubMed] [Google Scholar]
- (92).Agency for Toxic Substances and Disease Registry. Chapter 3: Landfill Gas Safety and Health Issues. In Landfill Gas Primer - an Overview for Environmental Health Professionals; Agency for Toxic Substances and Disease Registry, 2001. [Google Scholar]
- (93).US, EPA. Municipal Solid Waste Landfills. https://www.epa.gov/landfills/municipal-solid-waste-landfills (accessed Feb 16, 2023).
- (94).US, EPA. Basic Information about Landfills, 2023. https://www.epa.gov/landfills/basic-information-about-landfills (accessed Oct 17, 2023).
- (95).Hunt EJ; Zhang C; Anzalone N; Pearce JM Polymer Recycling Codes for Distributed Manufacturing with 3-D Printers. Resour., Conserv. Recycl. 2015, 97, 24–30. [Google Scholar]
- (96).Chea JD; Lehr AL; Stengel JP; Savelski MJ; Slater CS; Yenkie KM Evaluation of Solvent Recovery Options for Economic Feasibility through a Superstructure-Based Optimization Framework. Ind. Eng. Chem. Res. 2020, 59 (13), 5931–5944. [Google Scholar]
- (97).Aboagye EA; Chea JD; Lehr AL; Stengel JP; Heider KL; Savelski MJ; Slater CS; Yenkie KM Systematic Design of Solvent Recovery Pathways: Integrating Economics and Environmental Metrics. ACS Sustainable Chem. Eng. 2022, 10 (33), 10879–10887. [Google Scholar]
Associated Data
This section collects any data citations, data availability statements, or supplementary materials included in this article.