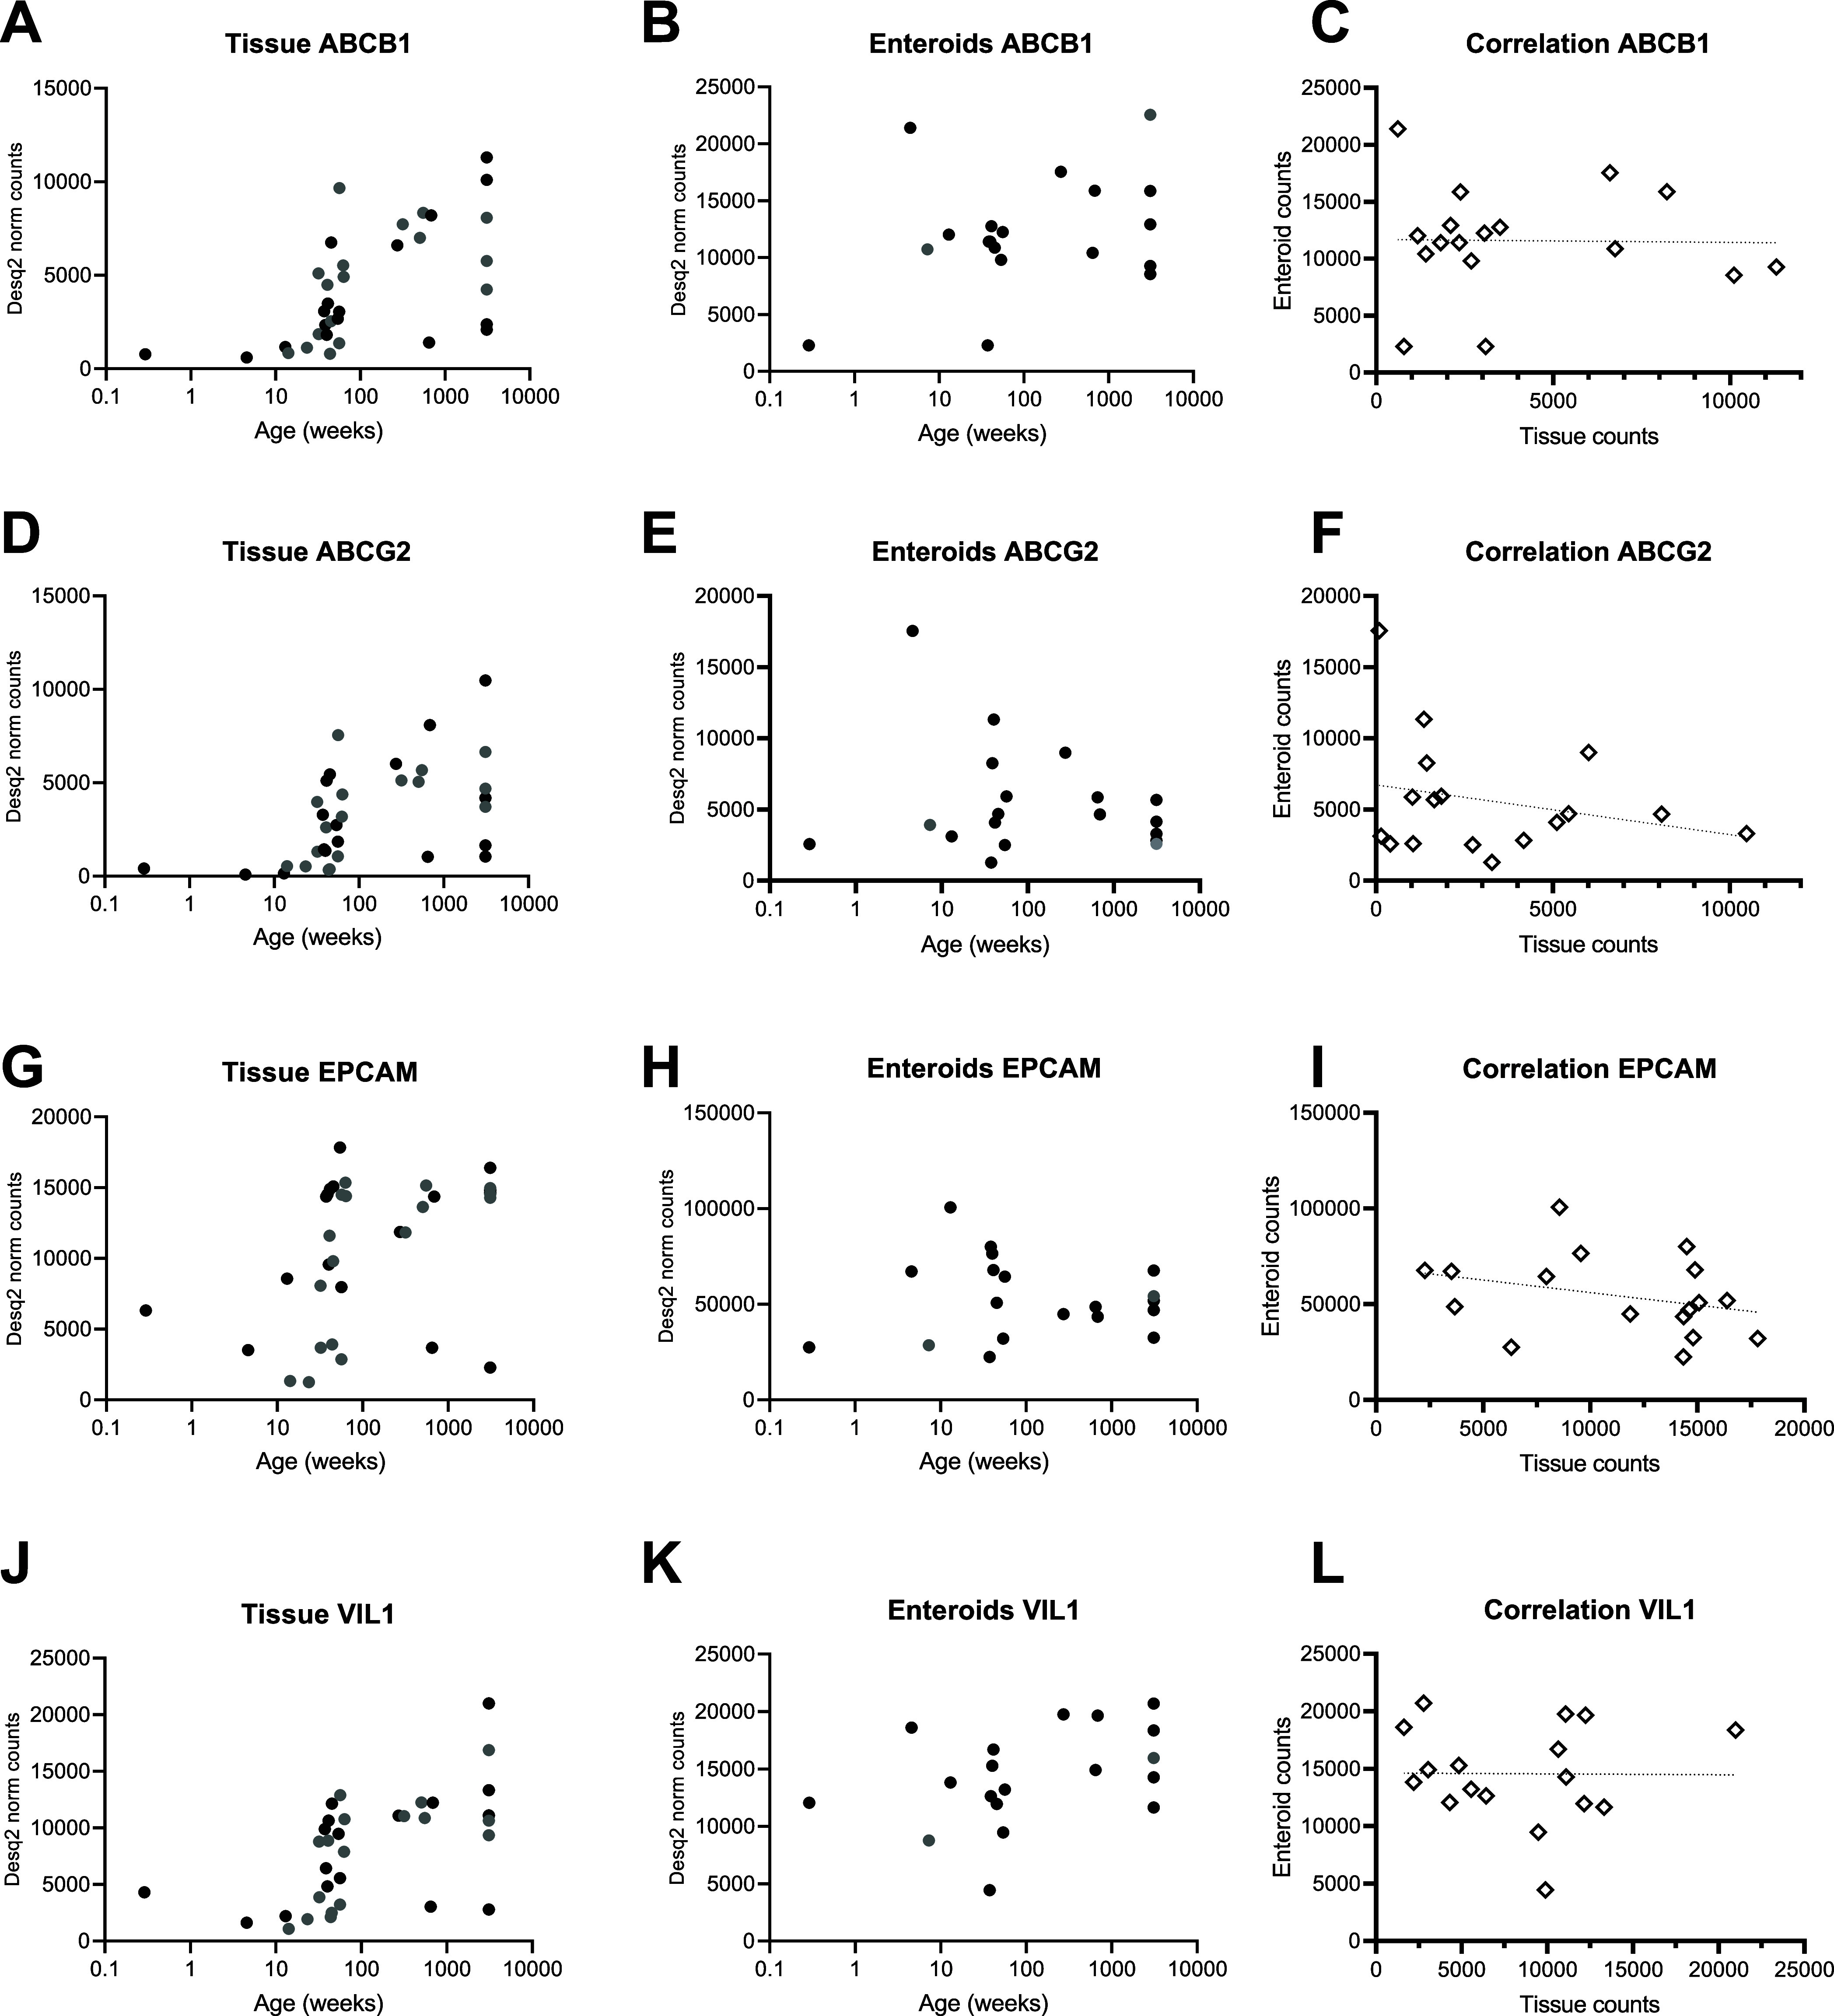
Figure 6.

Gene expression of ABCB1 (P-gp) and ABCG2 (BCRP) in tissue n = 34 and in enteroid monolayers n = 18 across the age range. Black dots are donors with tissue and enteroid measurement. Gray dots miss one of the two models. (A) ABCB1 in tissue, (B) ABCB1 in enteroid monolayers, (C) correlation of ABCB1 expression between tissue and enteroid monolayers, (D) ABCG2 in tissue, (E) ABCG2 in enteroid monolayers, (F) correlation of ABCG2 expression between tissue and enteroid monolayers, (G) EPCAM in tissue, (H) EPCAM in enteroid monolayers, (I) correlation of EPCAM expression between tissue and enteroid monolayers, (J) VIL1 in tissue, (K) VIL1 in enteroid monolayers, and (L) correlation of VIL1 between tissue and enteroid monolayers.
