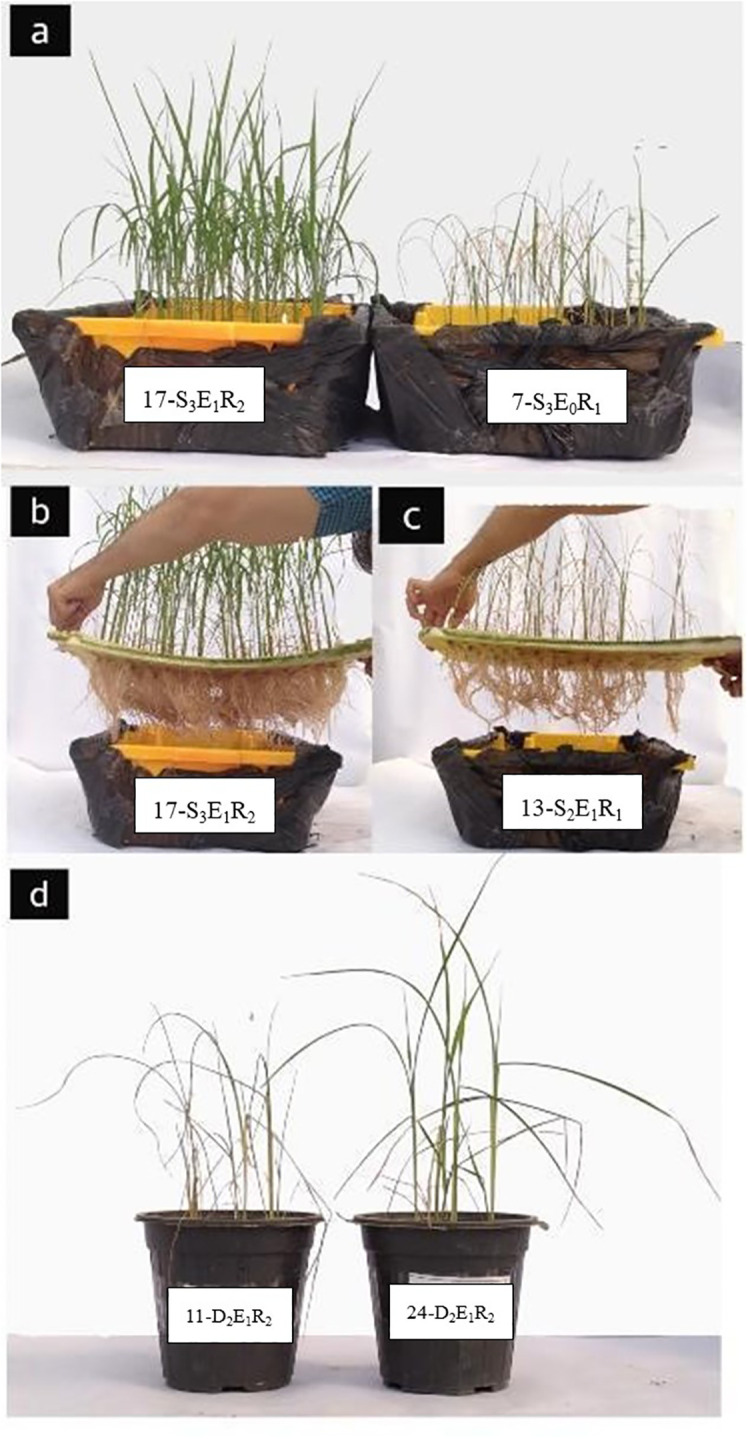
Figure 1.

Visual representation of the experimental setup and comparisons of treatments. (A) Example demonstration of shoot biomass comparison between inoculated (left) and non-inoculated (right) rice crop at a salinity level of 100 mM. Corresponding root biomass comparison of inoculated (B) versus non-inoculated (C) rice crop. (D) Visual contrast in shoot biomass between inoculated (right) and non-inoculated (left) crop under 50% field capacity (FC) drought stress. The letters D, E, S, and R on the labels denote drought level, presence (E1) or absence (E0) of inoculation, salinity level, and replicate, respectively.
