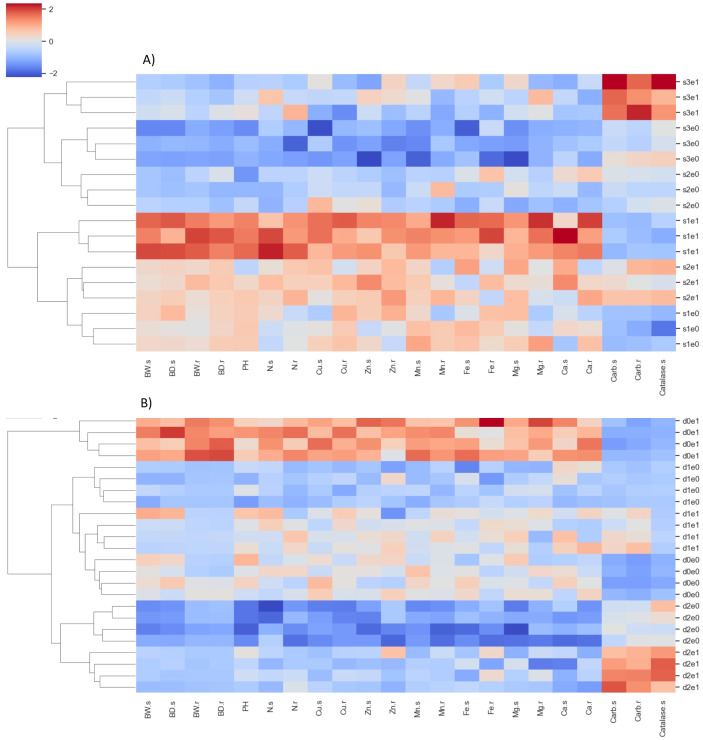
Figure 10.
Heatmap illustrating the results of hierarchical clustering analysis based on Euclidean distance and Ward’s functions. Each cell displays a standardized value corresponding to nutrient content and biomass in plants subjected to salinity (A) and drought (B) stresses. The analysis includes treatments with all four replicates. Plant properties labels on the x-axis are suffixed with s and r, denoting shoots and roots, respectively. Treatment labels on the y-axis, such as s1-3 and d0-2, indicate the level of salinity and drought, respectively. Abbreviations e0 and e1 denote the absence or presence of P. indica inoculation.BW is weight biomass, BD is dry biomass, PH is plant height.

