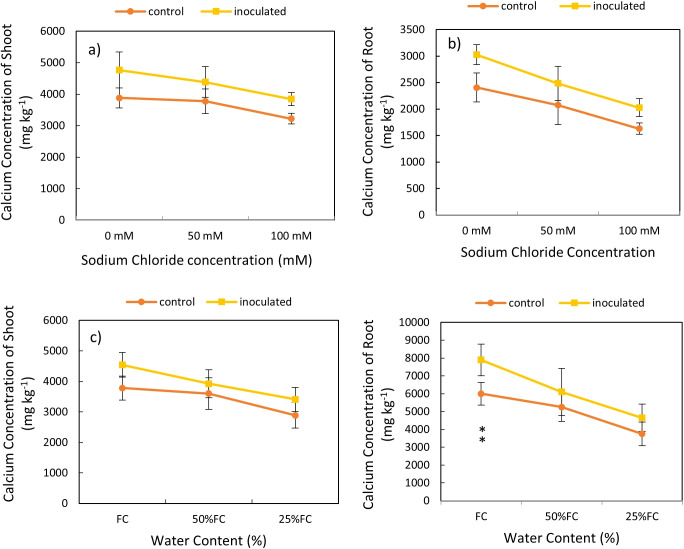
Figure 6.
Interactive effect of P. indica inoculation-salinity on calcium (Ca) Concentration of shoots (A) and roots (B) and the interactive effect of P. indica inoculation-drought on Ca concentration of shoots (C) and roots (D). The single- and double-star asterisk indicate significant difference between inoculated and control treatments at particular salinity or drought level according to paired T-test at 95 and 99% confidence levels, accordingly. The vertical error bars in the figures denote standard error.

