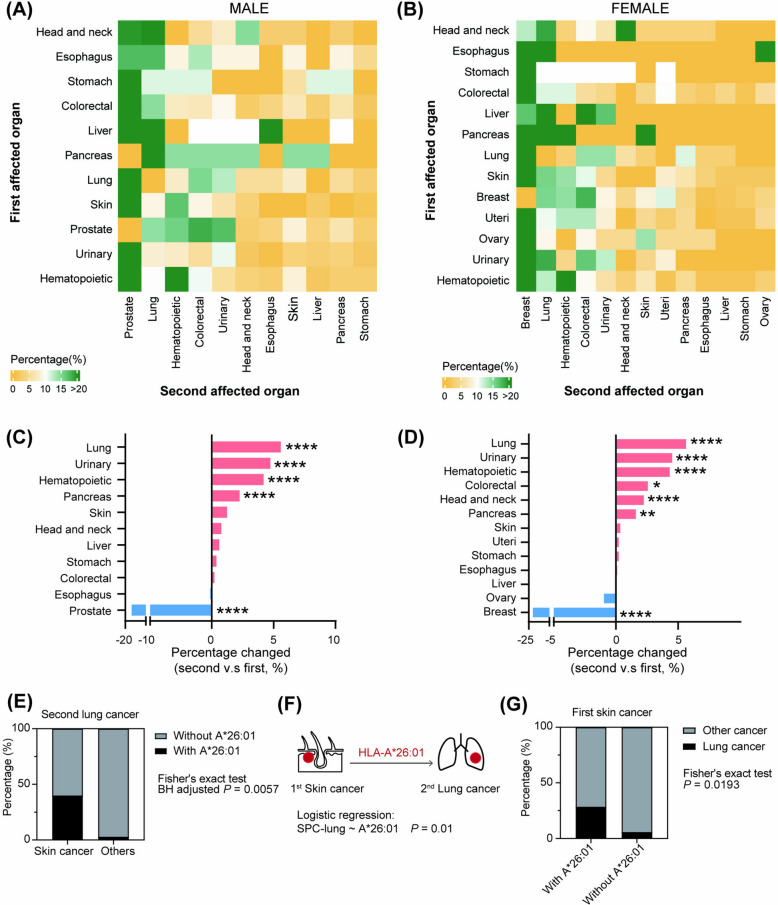
Fig. 3.
Profile of the first and second cancers and organ-specific HLA indication. A–B Heatmap showing the distribution of subsequent cancers. C–D Bar plot showing the changes of constitute ratio in the subsequent setting versus the first setting. The value was presented as the percentage in the second setting minus that in the first. Chi-square test was used for statistical analysis. *P < 0.05, **P < 0.01, and ****P < 0.0001. E Frequency of A*26:01 in second lung cancer male patients divided by first cancer (skin versus others). The Fisher’s exact test was applied with BH multiple comparisons. F Schematic model indicating the role of A*26:01 in skin-to-lung organ-specific SPC incidence. Logistic regression was applied. G Frequency of second lung cancer in first skin cancer patients divided by A*26:01 status

