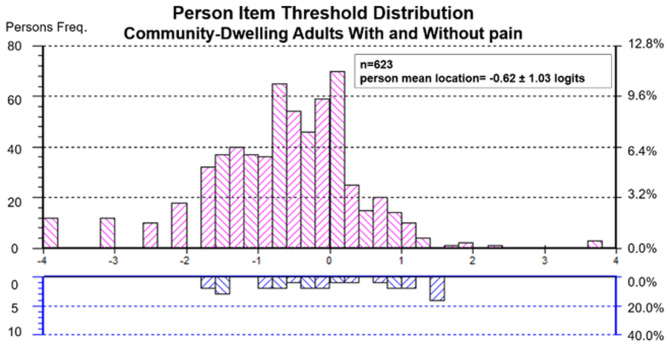
Fig. 1.
Person-item threshold distribution maps. Legend: The histogram shows the frequency of adults with and without musculoskeletal pain at their level of body awareness ability (pink histograms). Body awareness ability ranges from high (lowest logit value on the left side of the scale) to low (highest logit value on the right side of the scale). At the bottom of the figure, the blue histograms represent the frequency of item thresholds. Following the same logit scale, the hardest items are shown on the left, and the easiest items are shown on the right

