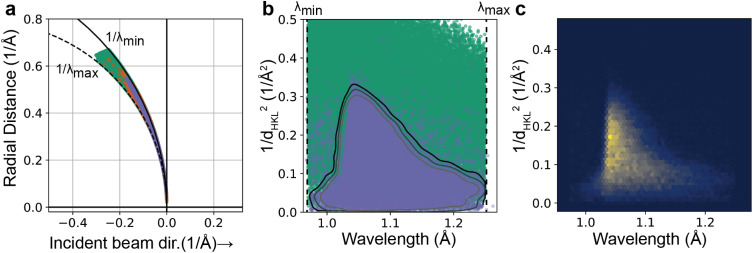
FIG. 4.
Spot prediction and the use of a resolution-dependent bandwidth. (a) Ewald diagram for an experimental DHFR dataset, showing the limiting Ewald spheres at the minimum and maximum wavelength ( and ) used for spot prediction (solid and dashed circular segments, respectively), with predicted reflections (green, random subset of 100 000 reflections), observed reflections (orange), and retained predicted reflections (blue-gray) mapped onto the diagram. The y-axis denotes the radial distance from the incident beam vector. (b) Same predicted and observed reflections in the data representation used for kernel density estimation (KDE). Contours: curves of constant KDE probability density. The retained reflections in panel (a) correspond to the outer contour. (c) Two-dimensional histogram of the observed (strong) reflections.

