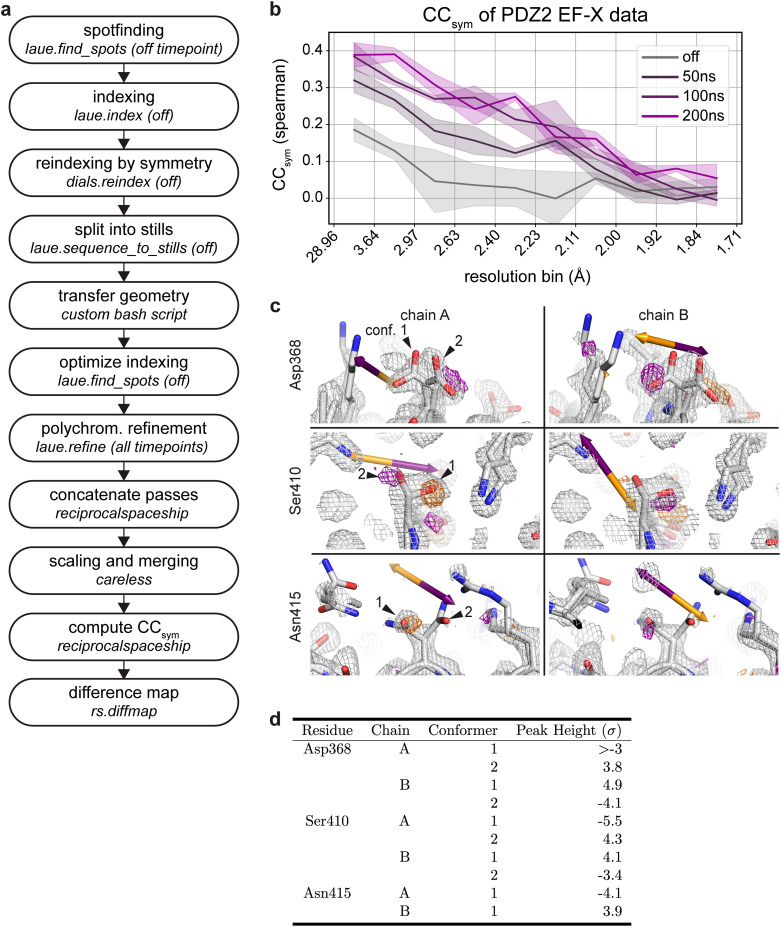
FIG. 9.
Time-resolved signal in an EF-X dataset processed with Laue-DIALS. The dataset is from an EF-X experiment on PDZ2 with one OFF and three ON timepoints, originally reported in Hekstra et al. 2016. (a) Flow chart of the processing workflow. (b) Plot of as a function of resolution bin for each timepoint. (c) Weighted ON-OFF isomorphous difference maps showing electric-field induced side chain motions. Orange arrows depict the direction of the electric field, and purple arrows depict the opposite direction. Orange density represents a decrease in density in the ON map compared to the OFF map, and purple density represents increased density in the ON map. Maps are contoured at 3σ and carved within 1.5 Å of shown atoms. There is an increase in electron density on Asp368 carboxylate conformer 2 in one symmetry mate (chain A, top left) and conformer 1 in the other (chain B, top right). There is an increase in electron density on Ser410 hydroxyl conformer 2 in one symmetry mate (chain A, middle left) and conformer 1 in the other (chain B, middle right). There is a decrease in electron density on Asn415 carboxamide conformer 1 in one symmetry mate (chain A, bottom left) and increase in the other (chain B, bottom right). D. Heights of difference map peaks in (C).

