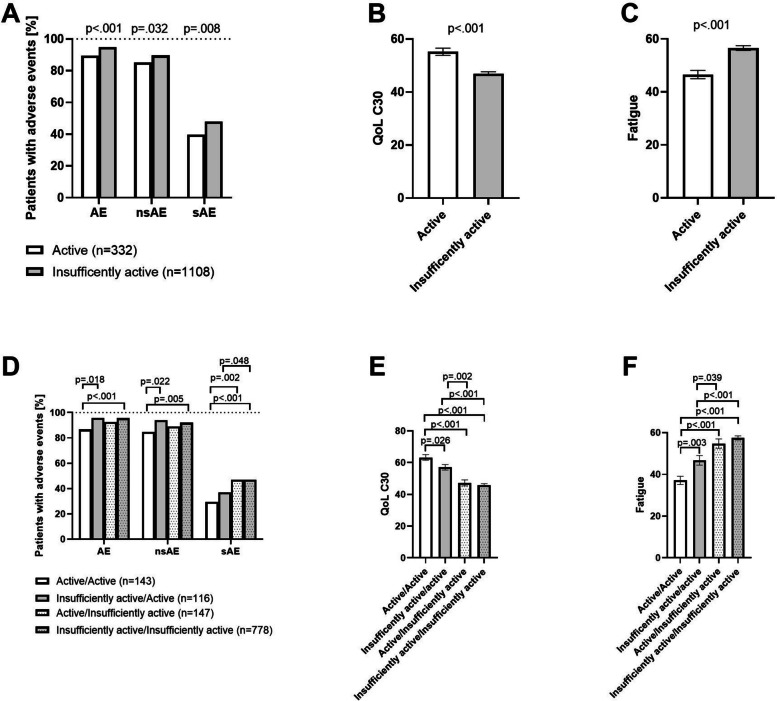
Fig. 2.
Comparison of adverse events, quality of life, and fatigue between baseline physical activity groups (A–C) as well as for changes in physical activity behavior during the course of the study (D–F). Occurrence of adverse events (AE), non-serious adverse events (nsAE), serious adverse events (sAE) (A), quality of life (QoL) (B), and fatigue (C) in relation to baseline physical activity groups. For A, the bars represent the proportion of participants who experienced at least one of the AEs shown. P-values for significant differences between groups in adverse events, quality of life, and fatigue are annotated

