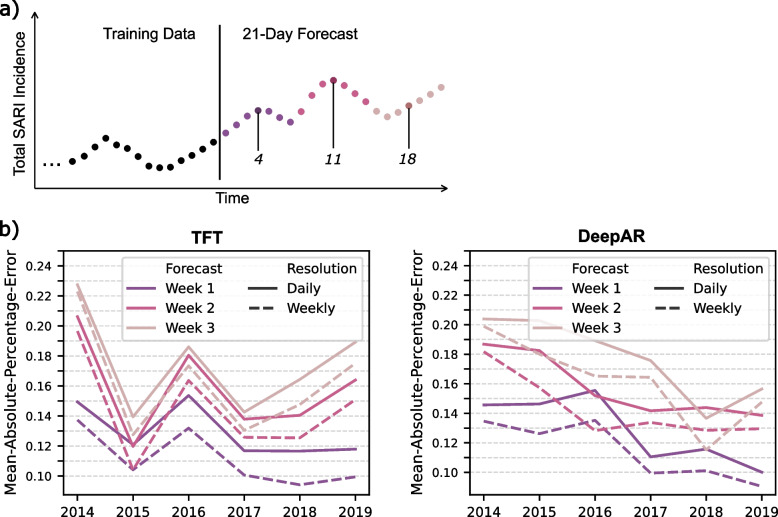
Fig. 5.
Forecasting error of predictions at two different resolutions. a Visualization of how the forecasting output is changed from daily to weekly resolution. The black dots represent the last observations in the time series used within the training set. The vertical black line represents the time point at which the time series has been split into training and testing sets, with 21 dots on the right-hand side representing the predictions for 21 days. The forecasting at daily resolution represents 21 values for 21 days. We analyzed the impact of changing the resolution by averaging over 7 days, as indicated by different colors, to compute a trend for the upcoming three weeks rather than 21-point predictions for each day. There are three mid-week time points at 4, 11, and 18 days. The forecasts for these days are used to compare the single-point forecast of a day (daily resolution) to the average of the forecasts for the week (weekly resolution). b The lines represent the model error for different years when the forecasting is used at different temporal resolutions as described in a

