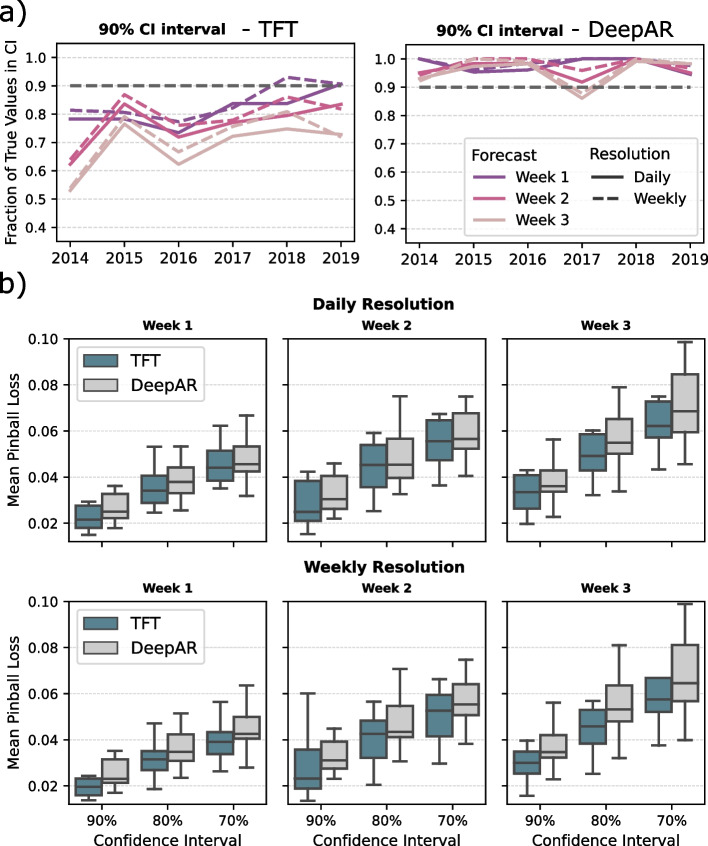
Fig. 6.
Evaluation of probabilistic forecasting. a The 90% confidence interval is validated by the fraction of true values captured within the confidence interval during the one-day walk-forward validation. The dashed black line represents the expected probability of the true value lying within the confidence interval estimated by the model. The colored lines represent the actual fraction of values from the testing sets that are within the confidence interval when applying the one-day walk-forward validation. Again, the forecasts are evaluated at different temporal resolutions. b The quantile levels are validated for the different confidence intervals 70%, 80%, and 90% using the mean pinball loss. This has been done for the two algorithms in comparison, as indicated by the colors. Subtitles describe the horizon and forecast resolution

