
FIGURE 5.
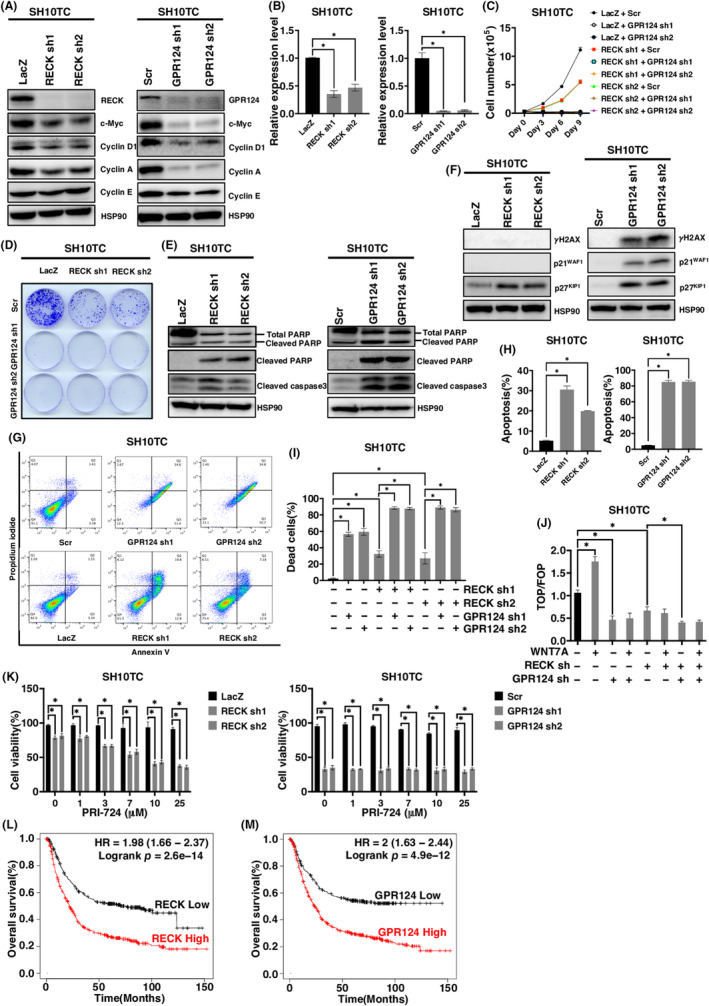
The effect of RECK and GPR124 depletion in SH10TC cells. (A) Immunoblotting (IB) of the indicated proteins in RECK‐depleted (left) or GPR124‐depleted (right) SH10TC cells. (B) Relative mRNA expression levels of the indicated gene in RECK‐depleted (left) or GPR124‐depleted (right) SH10TC cells (N = 3). (C) Cell proliferation curve of SH10TC cells infected with lentivirus carrying shRNA targeting the indicated gene in the indicated combination. (D) Representative images of colony formation by SH10TC cells analyzed in (C). (E, F) Immunoblotting of the indicated proteins in RECK‐depleted (left) or GPR124‐depleted (right) SH10TC cells. (G) Representative results of flow cytometry analysis of SH10TC cells infected with the indicated lentivirus. (H) Quantitation of flow cytometry analyses of RECK‐depleted (left) and GPR124‐depleted cells (right) (N = 3). (I) The percentage of dead SH10TC cells infected with the indicated lentivirus assessed by trypan blue staining (N = 3). (J) TOP/FOP canonical WNT/β‐catenin reporter assay of SH10TC cells infected with the indicated lentivirus and treated with or without WNT7A. (K) Viability of SH10TC cells infected with the indicated lentivirus and treated with the indicated concentration of PRI‐724 for 72 h (N = 3). (L) Kaplan–Meier survival curves for patients with gastric cancer with high and low RECK expression. p = 2.6 × 10⁻¹⁴ by long‐rank test. (M) Kaplan–Meier survival curves for patients with gastric cancer with high and low GPR124 expression. p = 4.9 × 10⁻¹² by long‐rank test. *p < 0.05 against vector control; N.S., not significant.