
FIGURE 1.
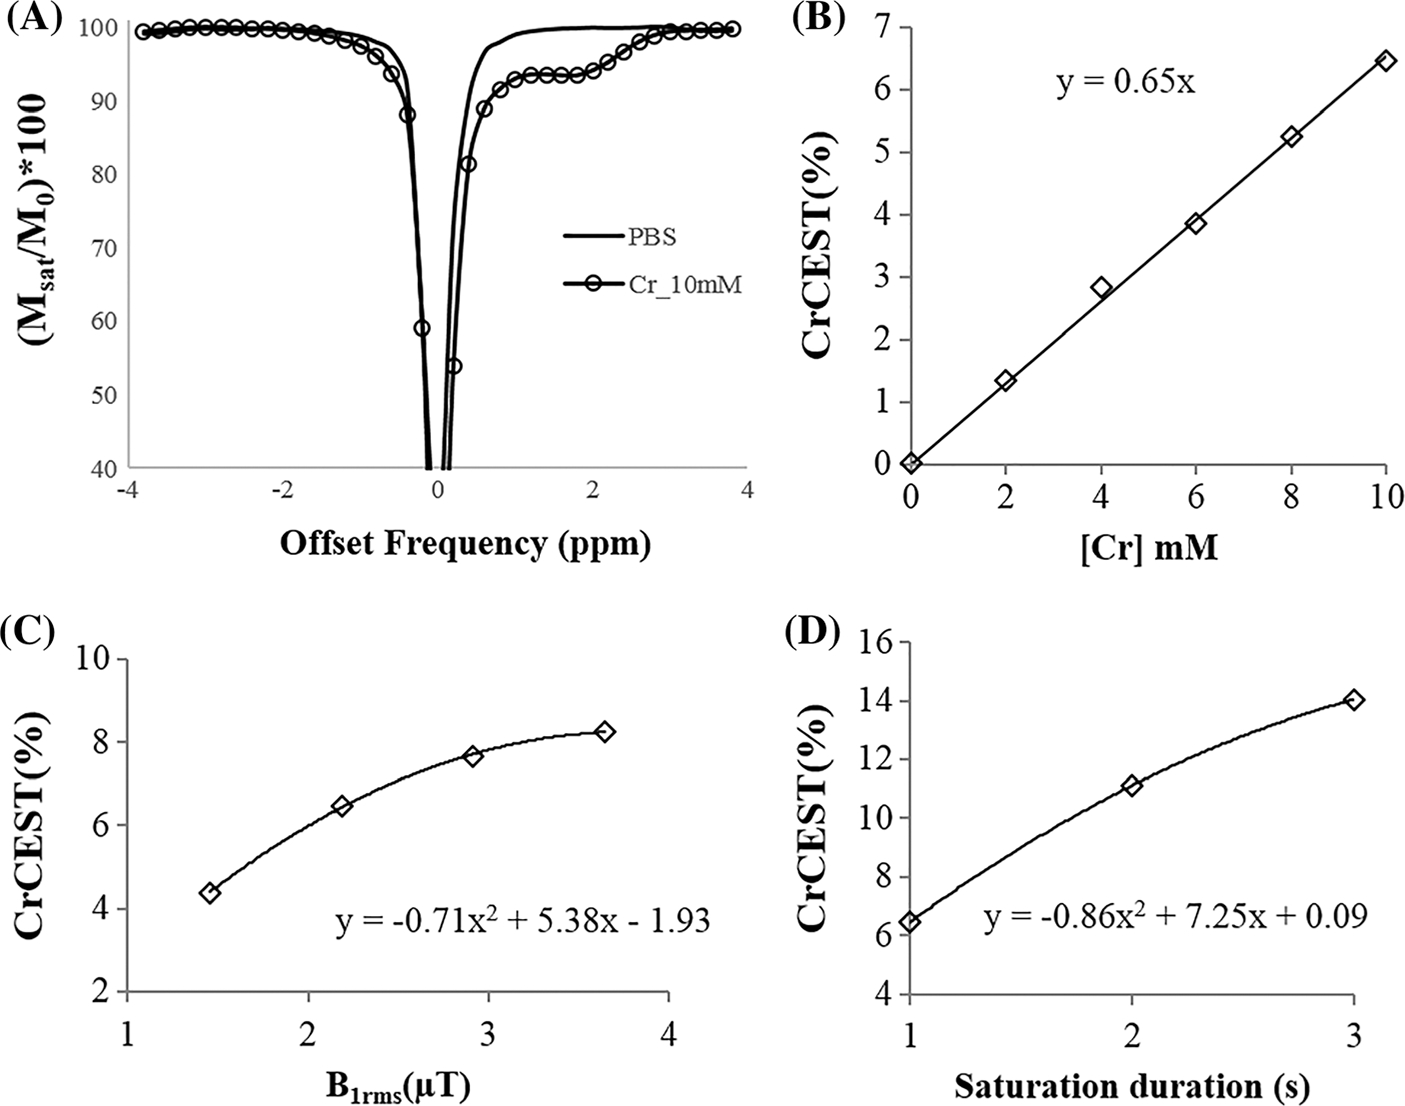
(A) Z-spectra of Cr (10 mM) and PBS using a saturation B1rms of 2.2 μT and duration of 1 second. (B) Dependence of Cr-w CEST as contrast on Cr concentration ([Cr]) using a B1rms of 2.2 μT and duration of 1 second. (C) Dependence of Cr-w CEST contrast on saturation power for a fixed duration of 1 second and (D) dependence on saturation duration for a fixed saturation B1rms of 2.2 μT. Phantom data was acquired at temperature of 37 ± 1°C and pH of 7.0. Here, y represents CrCEST (%) and x represents [Cr] in (B), B1rms in (C) and saturation duration in (D)