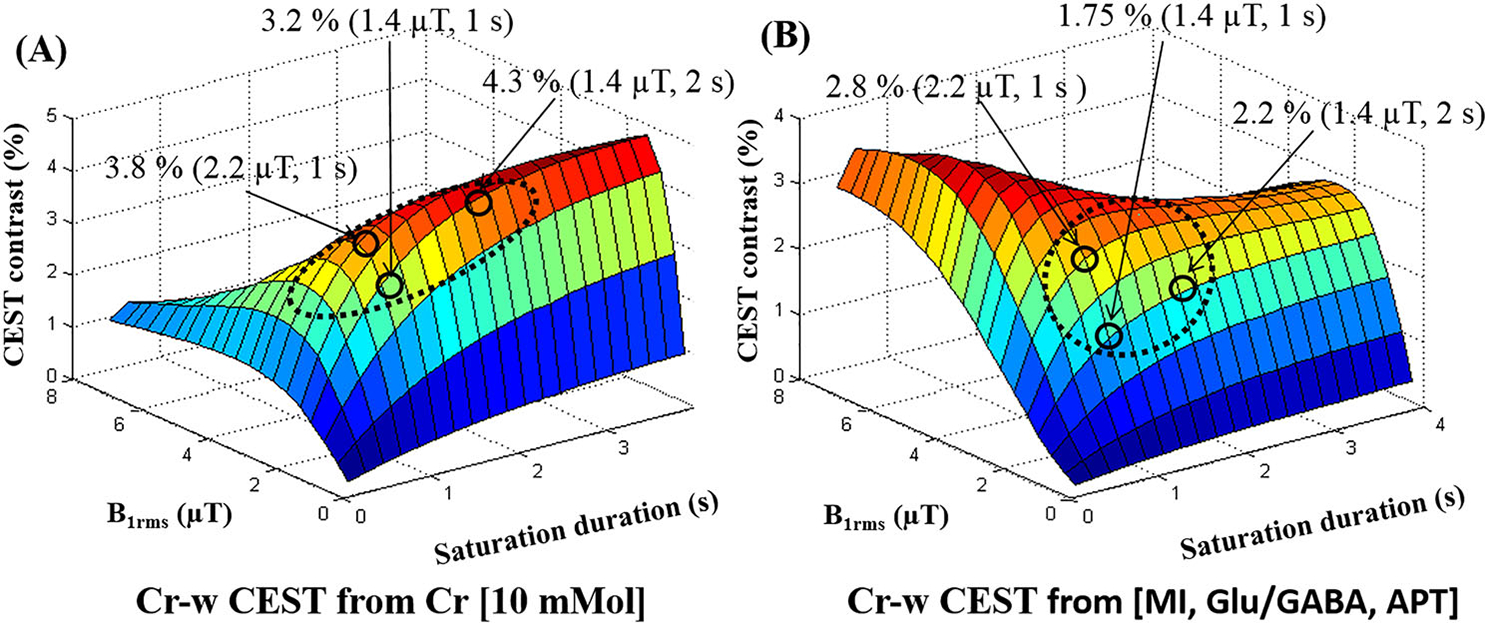
FIGURE 2.

Surface plots demonstrating dependence of Cr-weighted (w) CEST contrast at 1.8 ppm on B1rms and saturation duration using numerical simulations at 7 T. (A) CEST contrast from Cr [10mM] only. (B) CEST effect from combined metabolites [MI, Glu/GABA, APT] except Cr at 1.8 ppm. Arrows point to the three different saturation values and corresponding contrast. Circles show regions corresponding to optimum range of saturation parameters. Dotted ellipse highlight the regions for optimal CrCEST contrast with less contamination. APT, amide proton transfer; Glu, glutamate; MI, myo-inositol
