
FIGURE 3.
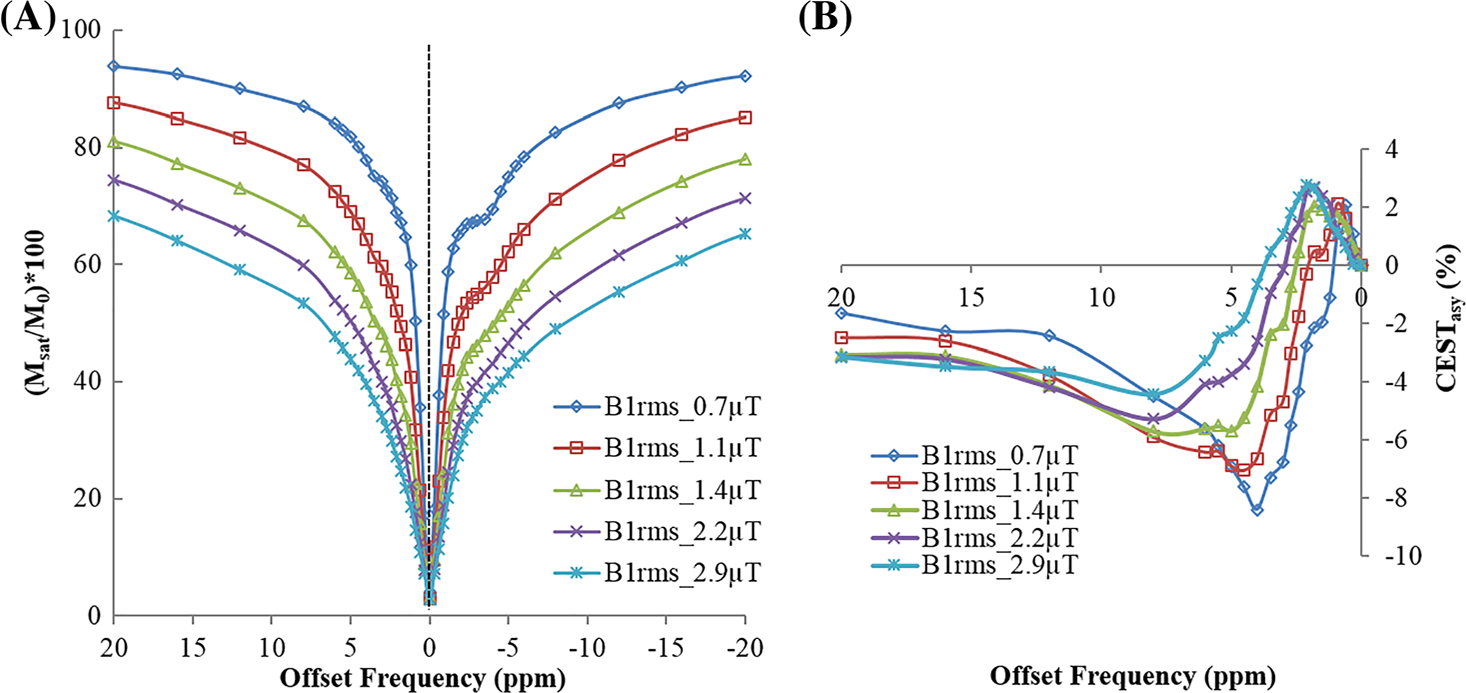
(A) Z-spectra and (B) asymmetry plot from a region of interest in gray matter tissue of human brain at 7 T with a saturation pulse B1rms of 0.7, 1.45, 2.2 and 2.9 μT and duration of 2 seconds. Asymmetry plots in (B) use normalization by signal without saturation (M0)