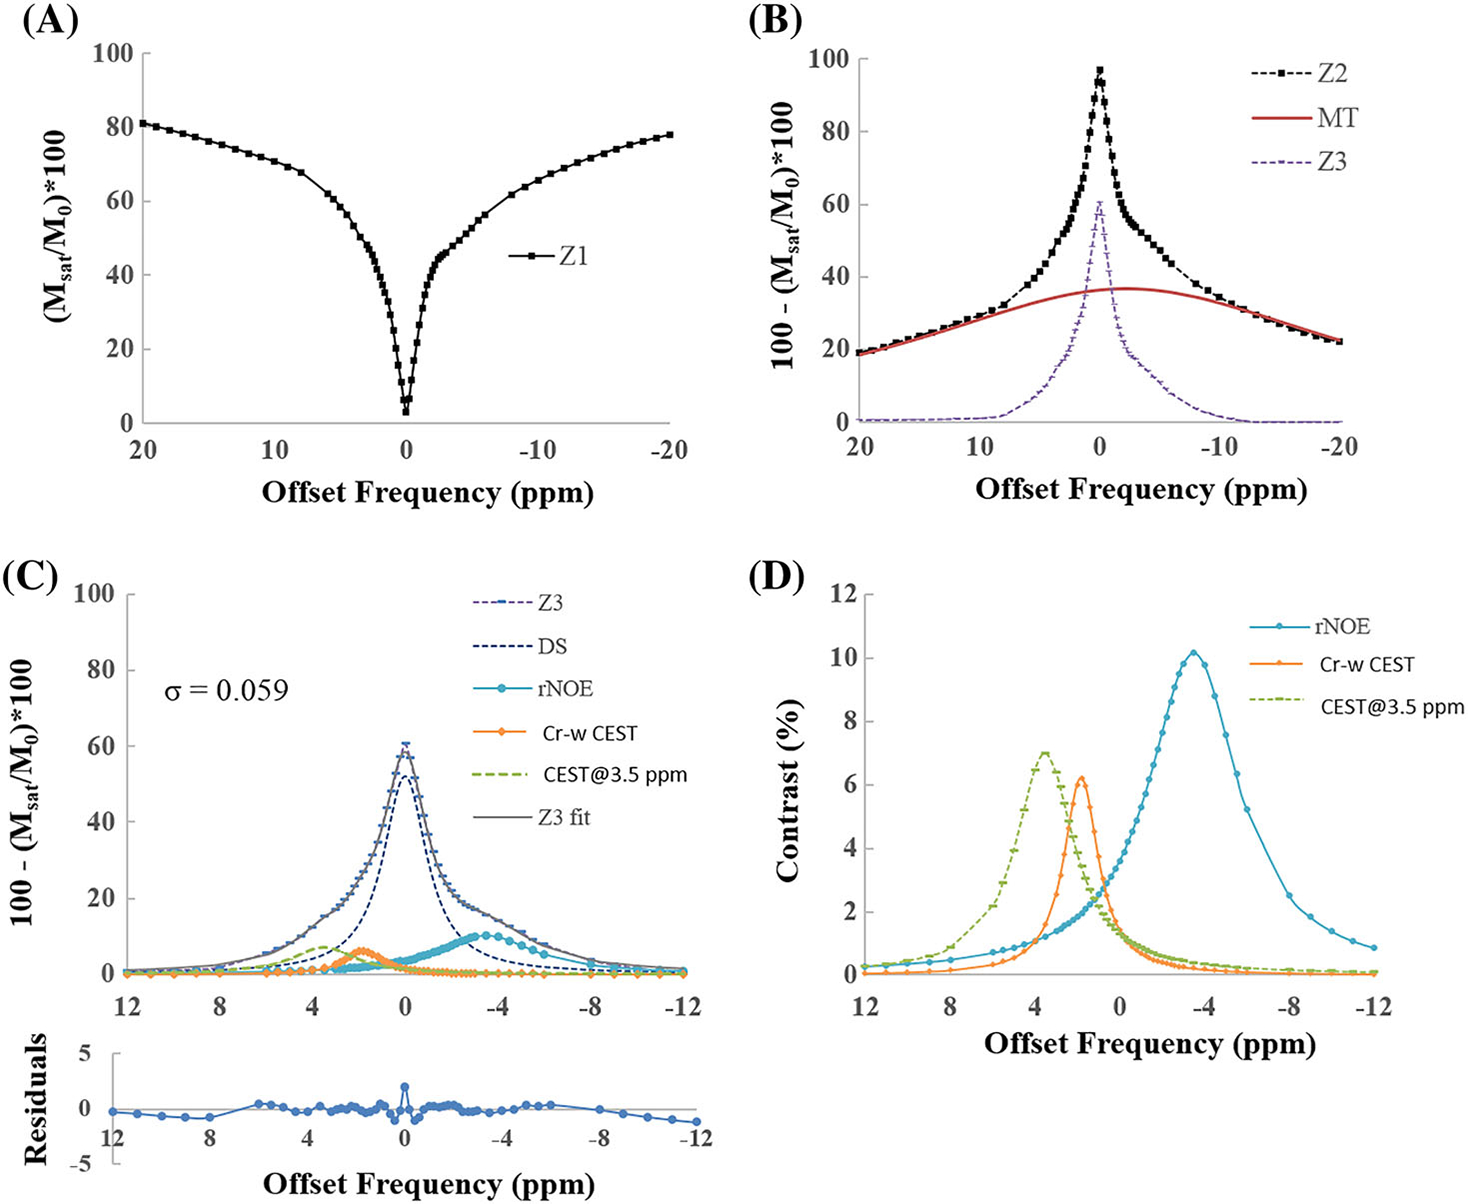
FIGURE 5.

Plots show an example of fitting in vivo Z-spectra, from region of interests in gray matter tissue, for a B1rms of 1.45 μT and duration of 2 seconds using model 2. (A) Original Z-spectra (Z1). (B) Scaled Z-spectra (Z2) along with fitted MT component and Z-spectra after removal of MT component (Z3). (C) Four-pool fitting of Z3 along with various fitted components like DS, rNOE, Cr-w CEST and CEST@3.5 ppm contrast. R2 = 0.99 and residual errors are under 2%. (D) Individual CEST and rNOE components. Fitting of Z2 is performed over a range of −40 to +40 ppm and shown for a range of −20 to +20 ppm for better visualization. CEST@3.5 ppm, CEST contrast at 3.5 ppm; Cr-w CEST, CEST contrast at 1.8 ppm; DS, direct saturation; MT, magnetization transfer; rNOE, relayed nuclear Overhauser effect; σ, average residual error; R2, goodness of fit
