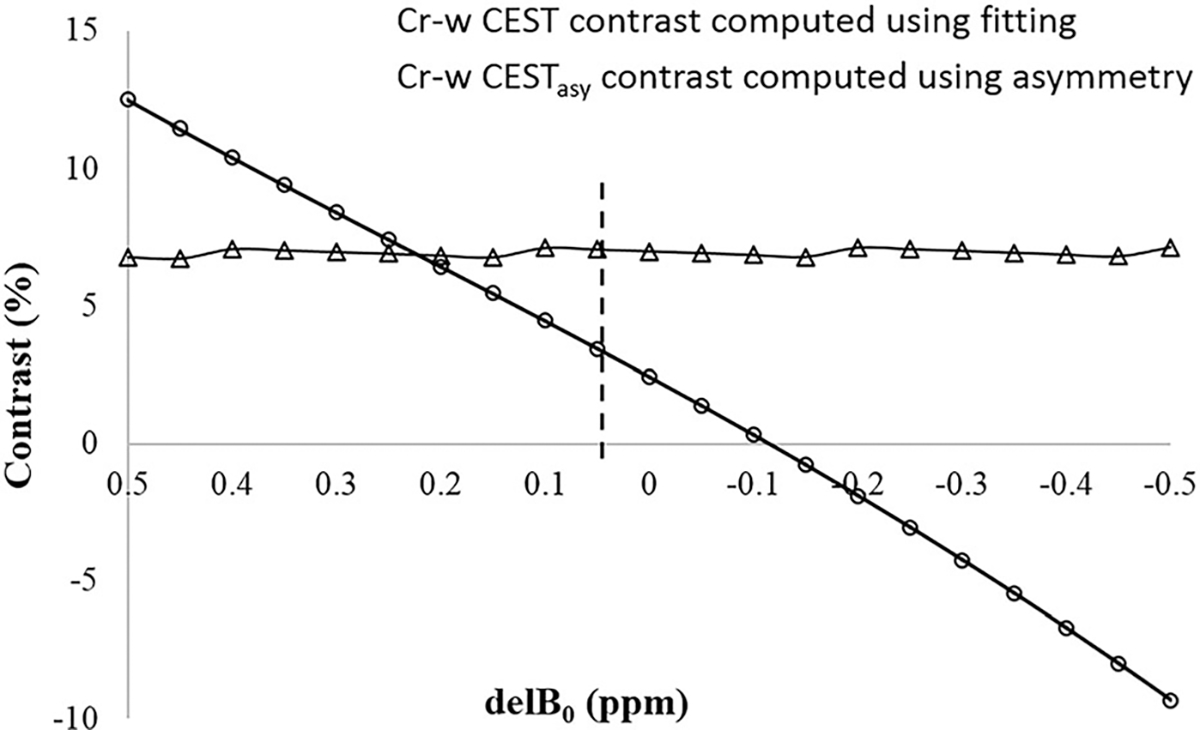
FIGURE 8.

Plots show the sensitivity of Cr-w CEST contrast computed using fitting approach to shift in resonance frequency (delB0). Z-spectra from a region of interest in gray matter tissue was selected followed by fitting. Simulated Z-spectra were generated by varying the center, corresponding to direct saturation of free water obtained using fitting, from −0.5 to 0.5 ppm. These simulated Z-spectra were fitted using model 2 for computing Cr-w CEST as well as for computing asymmetry contrast
