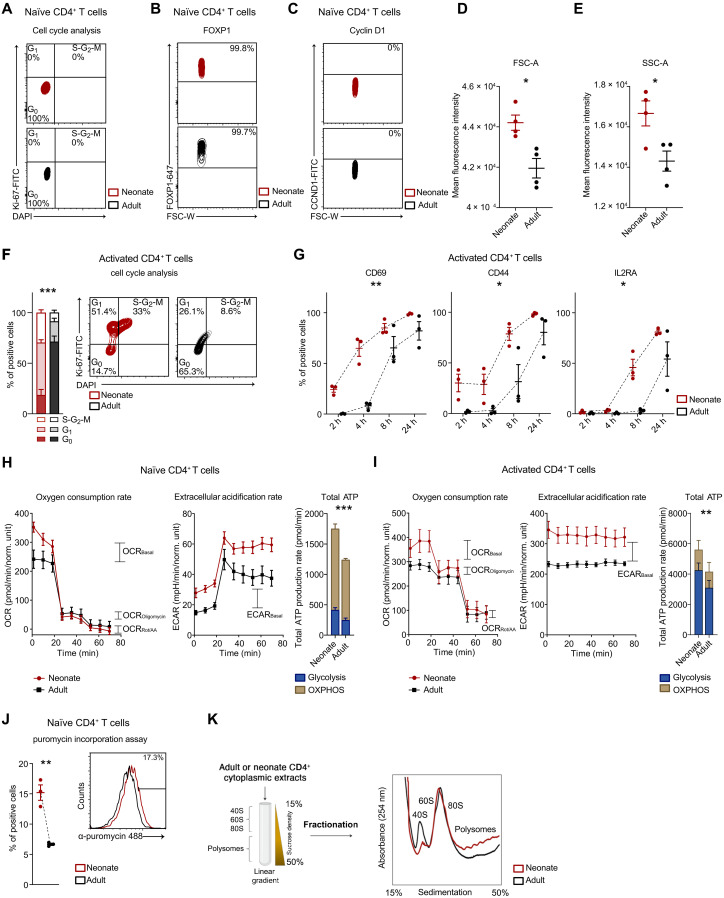
Fig. 1. Neonatal naïve CD4+ T cells exhibit a quiescent phenotype primed for activation, characterized by enhanced energy production and protein synthesis rate.
(A) Cell cycle analyses were performed using 4′,6-diamidino-2-phenylindole (DAPI) and Ki-67 staining in neonatal or adult naïve CD4+ T cells (n = 4). (B) FOXP1 and (C) CyclinD1 MFI (mean fluorescence intensity) in neonatal or adult naïve CD4+ T cells (n = 3). (D) Cellular size (FSC) and (E) granularity (SSC) MFI in neonatal or adult naïve CD4+ T cells (n = 4). FSC: *P = 0.0103; SSC: *P = 0.0250, unpaired one-tailed t test. (F) Cell cycle analyses in neonatal (n = 4) or adult (n = 5) CD4+ T cells activated for 36 hours. ***P ≤ 0.001, F = 61, two-way ANOVA. (G) Percentage of CD69-, CD44-, and IL2RA-positive naïve CD4+ T cells isolated from neonates or adults and activated for 2, 4, 8, or 24 hours (n = 3). CD69: **P = 0.003, F = 41.9; CD44: *P = 0.01, F = 20; IL2RA: *P = 0.01, F = 17.1, two-way ANOVA. (H and I) Representative kinetic profile of oxygen consumption rate (OCR) (left) and of extracellular acidification rate (ECAR) (middle) measured in neonatal or adult (H) naïve CD4+ T cells or (I) activated for 24 hours. Total ATP production rate (right) is represented as mitochondrial and glycolytic ATP (n = 3). ***P < 0.001, F = 303, two-way ANOVA. **P = 0.002, F = 20.4, two-way ANOVA. (J) Percentage of puromycin-positive neonatal or adult naïve CD4+ T cells (n = 3). **P = 0.003, unpaired two-tailed t test. (K) Schematic representation of polysome profiling technique (left). Polysome profile of neonatal or adult CD4+ T cells activated for 36 hours (right). All data represent mean ± SEM; n refers to individuals.

