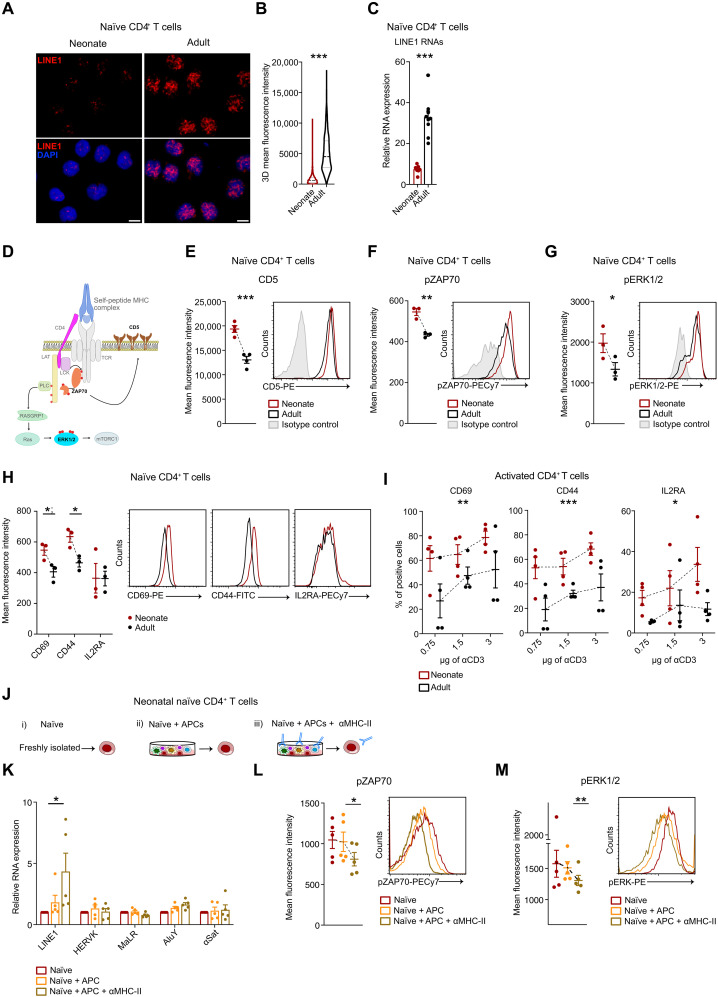
Fig. 2. The expression of LINE1 is absent in neonatal naïve CD4+ T cells due to tonic TCR stimulation.
(A) LINE1 RNA-FISH in naïve CD4+ T cells from neonates or adults, magnification 63×; scale bar, 5 μm, and (B) relative quantification (at least 500 nuclei, n = 3). ***P < 0.001, unpaired two-tailed t test. (C) LINE1 expression by RT-qPCR in naïve CD4+ T cells from neonates (n = 7) or adults (n = 9). ***P < 0.001, unpaired two-tailed t test. (D) Schematic representation of tonic TCR signaling. (E) CD5, (F) phospho-ZAP70 (Tyr319), and (G) phospho-ERK1/2 (Thr202/Tyr204) MFI in neonatal or adult naïve CD4+ T cells. CD5 (n = 4): ***P < 0.001, unpaired two-tailed t test; phospho-ZAP70 (n = 3): **P = 0.0039, unpaired two-tailed t test; phospho-ERK1/2 (n = 3): *P = 0.04, unpaired one-tailed t test. (H) CD69, CD44, and IL2RA MFI in neonatal or adult naïve CD4+ T cells (n = 3). *P = 0.0432; *P = 0.02, unpaired two-tailed t test. (I) Percentage of CD69-, CD44-, and IL2RA-positive naïve CD4+ T cells activated with different anti-CD3 concentrations (n = 4). CD69: **P = 0.0074, F = 9.111; CD44: ***P = 0.0002, F = 20.89; IL2RA: *P = 0.0117, F = 7.870, two-way ANOVA. (J) Schematic representation of the experiments in (K) to (M). Neonatal naïve CD4+ T cells are either freshly processed or cultured in complete medium with autologous APC, with or without α-MHC-II blocking antibodies. (K) LINE1, HERVK, MaLR, AluY, and α-Satellite expression by RT-qPCR (n = 5). *P = 0.05, paired one-tailed t test. (L) Phospo-ZAP70 (Tyr319) and (M) phospo-ERK1/2 (Thr202/Tyr204) MFI (n = 5). *P = 0.0102; **P = 0.0041, paired two-tailed t test. All data represent mean ± SEM; n refers to individuals.

