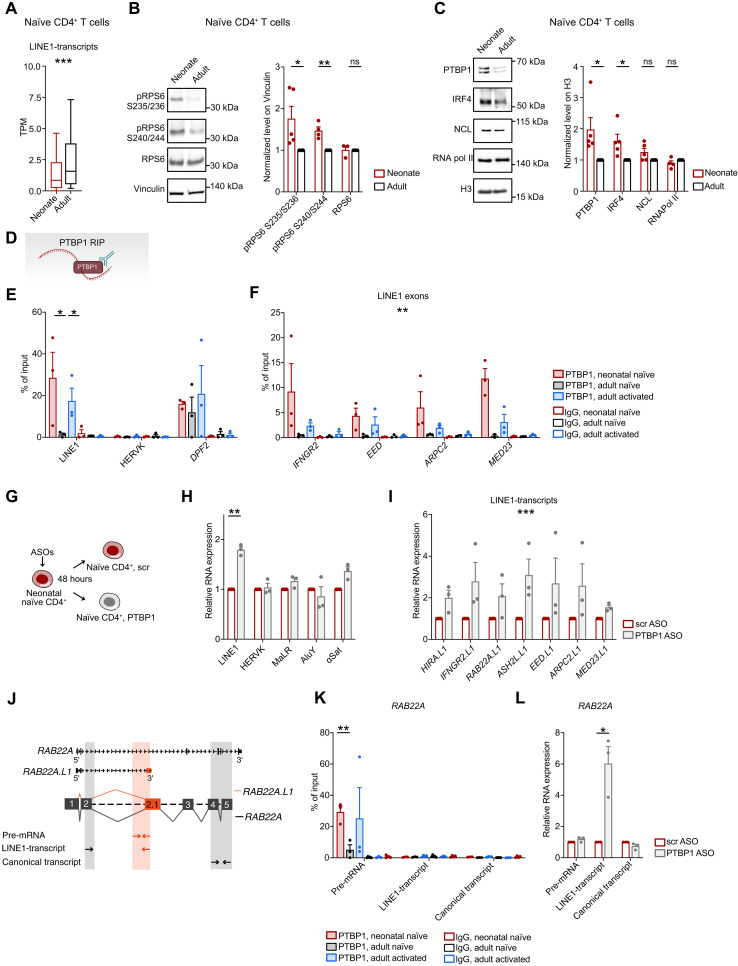
Fig. 3. mTORC1/PTBP1 suppress LINE1 expression in neonatal naïve CD4+ T cells.
(A) Expression levels of the 461 LINE1-transcripts identified in (15) in RNA-seq datasets (n = 4). ***P = 2.2 × 10⁻¹⁶, unpaired two-tailed Wilcoxon rank sum test. (B and C) Western blot analysis and quantification of (B) RPS6, phospho-RPS6 (Ser235/236 and Ser240/244) and (C) PTBP1, IRF4, NCL, and RNA Pol II in neonatal or adult naïve CD4+ T cells (Ser235/236, PTBP1, and IRF4, n = 5; Ser240/244, NCL, and RNA pol II, n = 4; RPS6, n = 3). Data were normalized on Vinculin or H3. Ser235/236: *P = 0.0356; Ser240/244: **P = 0.0022; PTBP1: *P = 0.0352; IRF4: *P = 0.0205, unpaired two-tailed t test. (D) Schema of PTBP1 RIP assay. (E and F) RIP for PTBP1 in neonatal or adult naïve and adult activated CD4+ T cells (n = 3). LINE1: neonatal versus adult naïve: *P = 0.05; adult naïve versus activated: *P = 0.03, unpaired one-tailed t test. LINE1 exons: neonatal versus adult naïve: **P = 0.001, F = 16, two-way ANOVA. (G) Schematic representation of PTBP1 knockdown with ASOs. (H) LINE1, HERVK, MaLR, AluY, α-Satellite, and (I) LINE1-transcripts expression by RT-qPCR in neonatal naïve CD4+ T cells treated with PTBP1 or control (scr) ASOs (n = 3). **P = 0.006, paired two-tailed t test; ***P < 0.001, F = 20.8, two-way ANOVA. (J) Scheme of RT-qPCR for RAB22A transcripts to inspect PTBP1 regulation on pre-mRNA, LINE1-transcripts, or canonical transcripts. (K) RIP for PTBP1 in neonatal or adult naïve and adult activated CD4+ T cells (n = 3). Neonatal versus adult naïve: **P = 0.009, unpaired two-tailed t test. (L) RAB22A isoform expression by RT-qPCR in neonatal naïve CD4+ T cells treated with PTBP1 or scr ASOs (n = 3). *P = 0.0445, paired two-tailed t test. All data represent mean ± SEM; n refers to individuals.

