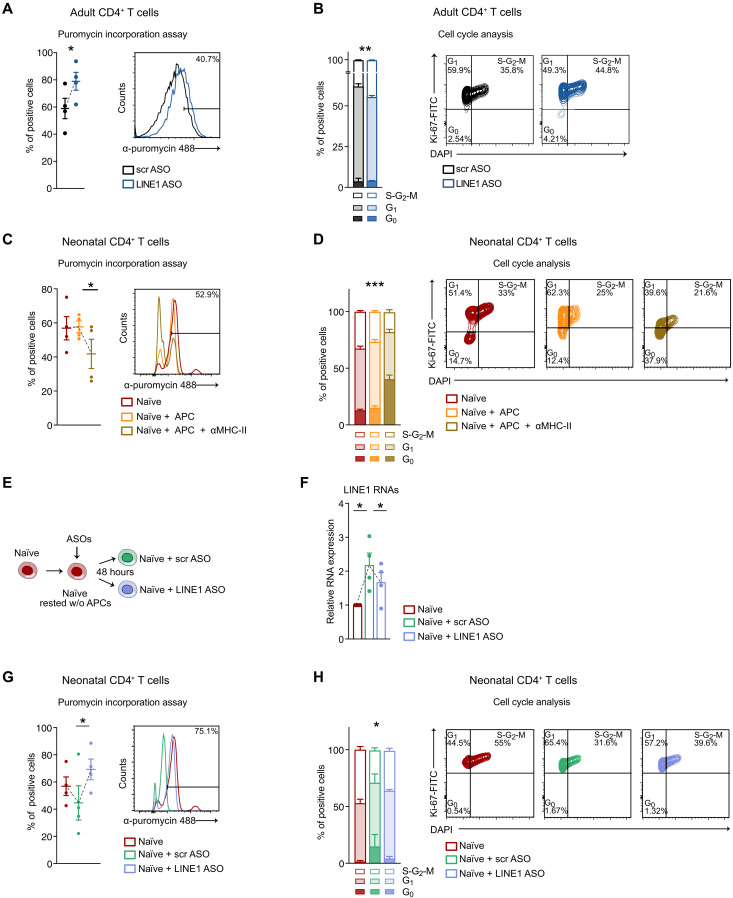
Fig. 5. LINE1 expression regulates protein synthesis and cell cycle progression.
(A) Percentage of puromycin-positive adult CD4+ T cells treated with LINE1 or scr ASOs and activated for 24 hours (n = 4). *P = 0.04, paired two-tailed t test. (B) Cell cycle analyses in adult CD4+ T cells treated with LINE1 or scr ASOs and activated for 72 hours (n = 3). **P = 0.009, F = 11.2, two-way ANOVA. (C) Percentage of puromycin-positive neonatal CD4+ T cells either freshly processed or cultured in complete medium with autologous APC, with or without α-MHC-II, and activated for 24 hours (n = 4). *P = 0.03, paired one-tailed t test. (D) Cell cycle analyses in neonatal CD4+ T cells either freshly processed or cultured in complete medium with APC, with or without α-MHC-II, and activated for 72 hours (n = 3). ***P < 0.001, F = 38.7, two-way ANOVA. (E) Schematic representation of the strategy used to induce LINE1 re-expression followed by subsequent depletion in neonatal naïve CD4+ T cells [experiments in (F) to (H)]. Neonatal naïve CD4+ T cells were either freshly isolated or cultured in complete medium to re-express LINE1 and subsequently treated with LINE1 or scr ASOs (F) LINE1 expression by RT-qPCR in neonatal naïve CD4+ T cells (n = 4). Naïve versus naïve + scr ASOs: *P = 0.02; naïve + scr ASOs versus naïve + LINE1 ASOs: *P = 0.05, paired two-tailed t test. (G) Percentage of puromycin-positive neonatal naïve CD4+ T activated for 24 hours (n = 4). *P = 0.03, paired one-tailed t test. (H) Cell cycle analyses in neonatal naïve CD4+ T cells activated for 72 hours (n = 3). *P = 0.04, F = 3.26, two-way ANOVA. All data represent mean ± SEM; n refers to individuals.

