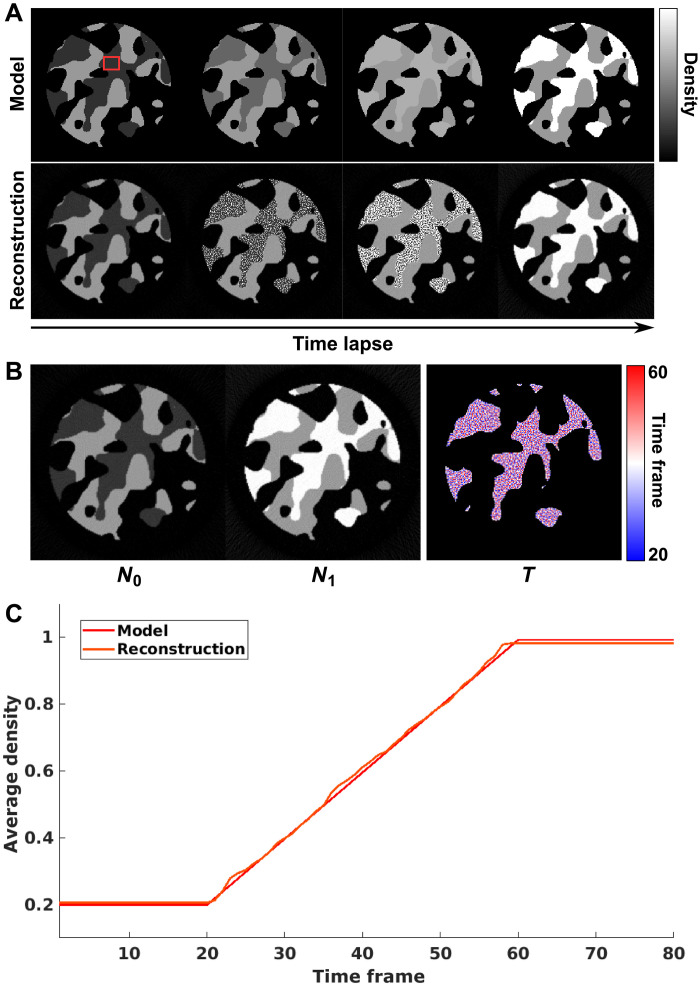
Fig. 10. Numerical simulation of gradual linear local density transition.
(A) Model and reconstructed time-lapse tomograms of the dynamic process based on gradual linear density changes. (B) Reconstructed results of N0, N1, and T. (C) Comparison between model and reconstructed average density dynamics of a 20 × 15 voxel region marked by red rectangle in (A).

