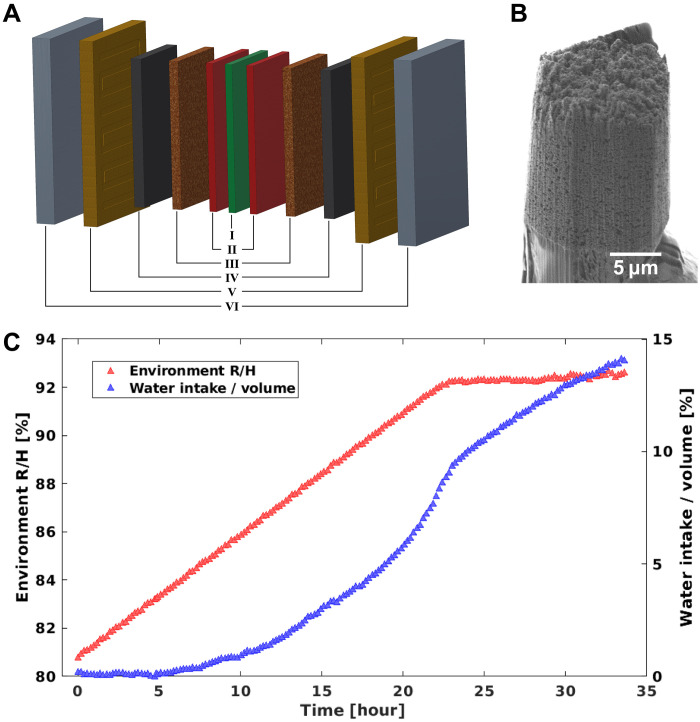
Fig. 3. PEFC sample.
(A) Schematic of the structure of a PEFC. The cell consists of (I) polymer electrolyte membrane layer composed of Nafion, (II) catalyst layers, (III) microporous layers, (IV) gas diffusion layers, (V) flow channels, and (VI) bipolar plates. (B) SEM image of the sample pillar, extracted from the catalyst layer (II). (C) Measurement process of the controller hydration of PEFC catalyst sample. Red triangles show the environment RH versus time, each triangle represents the starting time of one sparsely sampled tomography measurement. Blue triangles show the amount of water intake, which is estimated from the integrated ED obtained from 2D projections.

