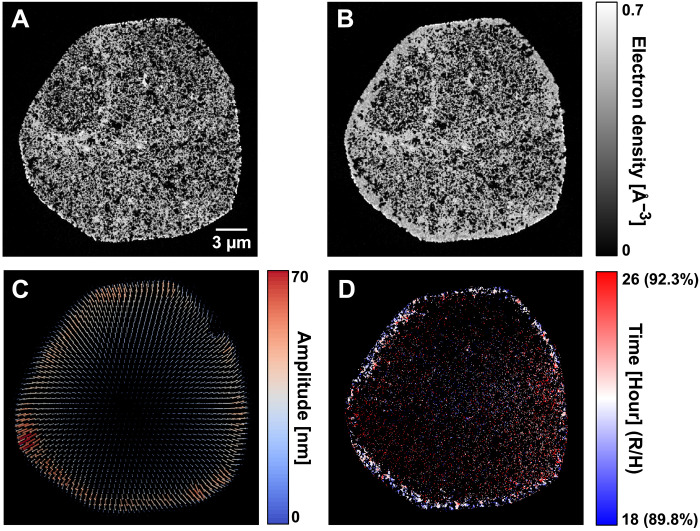
Fig. 4. Dynamic tomography reconstruction result of the catalyst sample.
(A) Axial tomographic slice of the reconstructed ED tomogram at start state. (B) The same slice of ED tomogram at end state, where filling of the pores can be observed. (C) Reconstructed deformation vector field of the sample between the start and end state. Arrows indicating the vector field are scaled up 15 times to improve visibility. (D) Map of the transition time T, or corresponding environment RH in parentheses, of the same slice. This map shows with color coding the time point when localized changes occur in each voxel.

