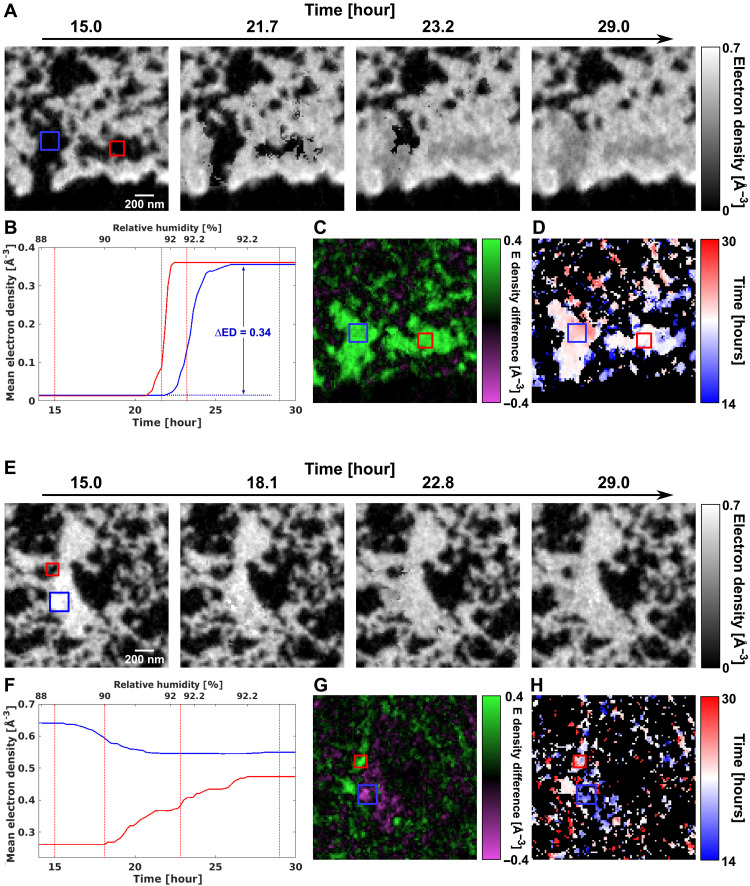
Fig. 5. Reconstruction inset of 1.7 × 1.7 μm2 areas in an axial tomography slice.
(A) Reconstructed time-lapse ED tomograms showing pore condensation. (B) Evolution over time of the average ED of the regions enclosed by blue and red rectangles in (A). Vertical lines denote the time frames of the tomogram insets shown in (A). The increase in ED matches that of water, 0.333 e/Å3. (C) ED difference between the start and end states. (D) Map of transition time of the region. (E) to (H) show the same contents, but for a second region that demonstrates water absorption and swelling of the ionomer.

