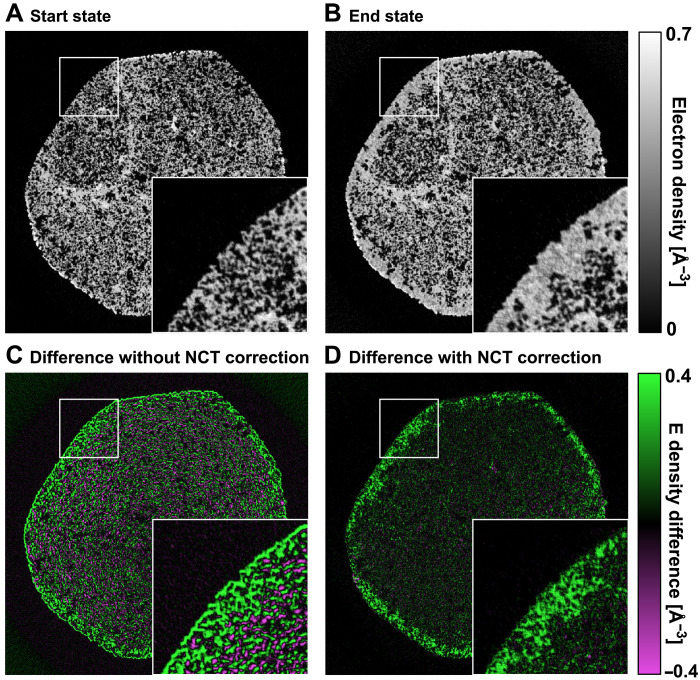
Fig. 6. Demonstration of NCT correction.
(A) An axial tomography slice from the reconstructed starting state of the sample. (B) Same tomography slice from the reconstructed end state of the sample. (C) Difference of ED between the start and end state of the sample without NCT correction, outlines around the pore edges are clearly visible, and the difference is heavily dominated by the sample geometrical expansion. (D) Difference between the two states after correction with NCT method, the outline artifacts are mostly removed, and the difference matches water filling of pores in the sample.

