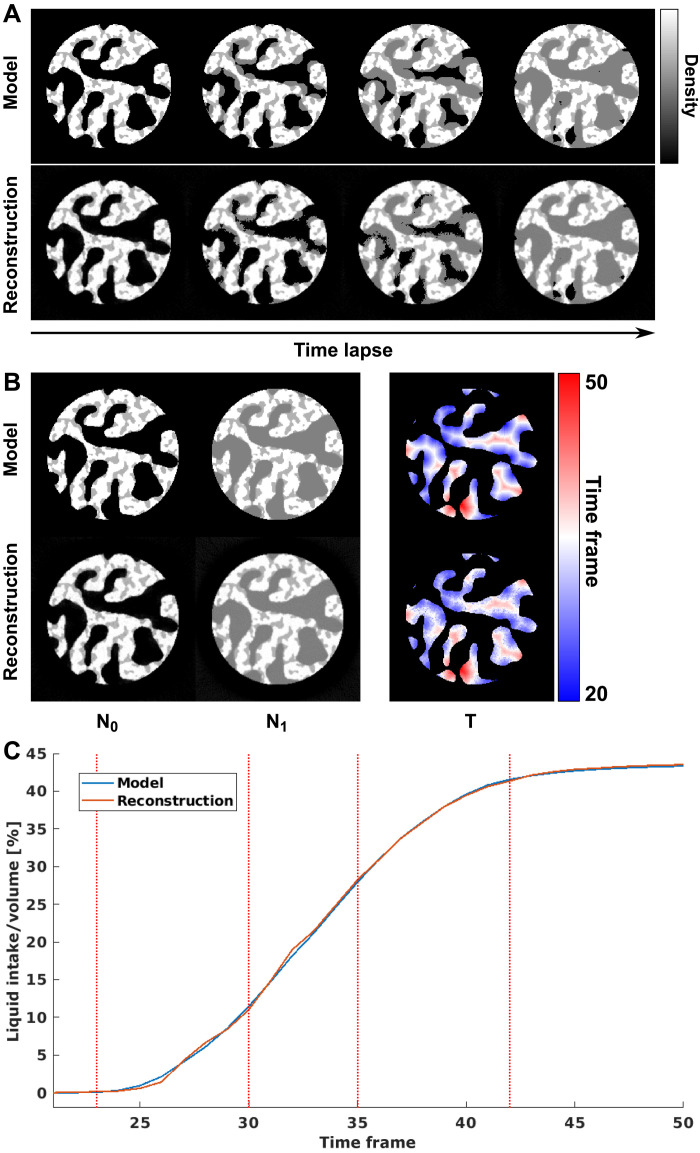
Fig. 9. Numerical simulation of liquid filling process in a porous sample.
(A) Model and reconstructed time-lapse tomograms of the dynamic process. (B) Model and reconstructed N0, N1, and T. (C) Comparison of total amount of liquid intake over time calculated from the model and the reconstruction. Dashed lines refer to the time frames shown in (A).

