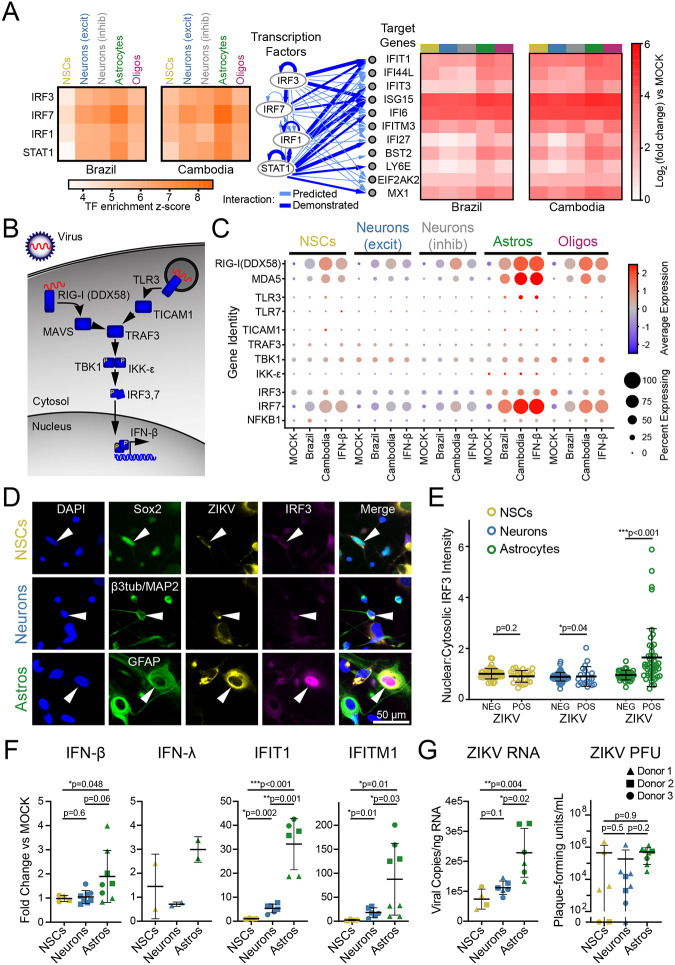
Figure 2. Astrocytes are innate immune sentinels in ZIKV infection.
(A) Top four transcription factors (left) predicted by ingenuity pathway analysis to drive gene expression changes (right) observed in ZIKV infection. (B) Schematic indicating key steps in innate immune activation engaged by pattern recognition receptors hypothesized to detect ZIKV (RIG-I and TLR3). (C) Dot plot representing steady state, IFN-β-, and ZIKV-induced expression levels for innate immune signal transduction components. Color scale represents normalized expression (scaled median z-score across all genes and all conditions represented in the plot). (D) Immunocytochemistry (ICC) of innate immune activation, indicated by nuclear translocation of IRF3, in ZIKV-infected mixed human fetal primary brain cells (Donor 2). Cells were identified using the following ICC labeling: NSCs, Sox2 (top); neurons, combined β3-tubulin and MAP2 (middle); astrocytes, GFAP (bottom). (E) Quantification of IRF3 translocation, measured as the ratio of nuclear-to-cytosolic immunofluorescence, demonstrated innate immune activation only in ZIKV-positive astrocytes. N=1 experiment (3 coverslips quantified per cell type) from donor 2, representative of two similar experiments from two donors. Error bars reflect mean ± SD; p-value calculated by Kolmogorov-Smirnov test. (F) FACS-purified NSCs (gold), neurons (blue), and astrocytes (green) reflect cell type-specific response to ZIKV with astrocytes generating the strongest upregulation in IFN-β and the interferon-responsive genes IFIT1 and IFITM1. N=three donors, four independent experiments. (G) ZIKV RNA (left) and infectious titer (right) in the same conditions as F. Graphs in F-G demonstrate mean ± SEM. P-values represent unpaired t-test with Welch’s correction; one-way ANOVA p-value <0.05 for all graphs.

