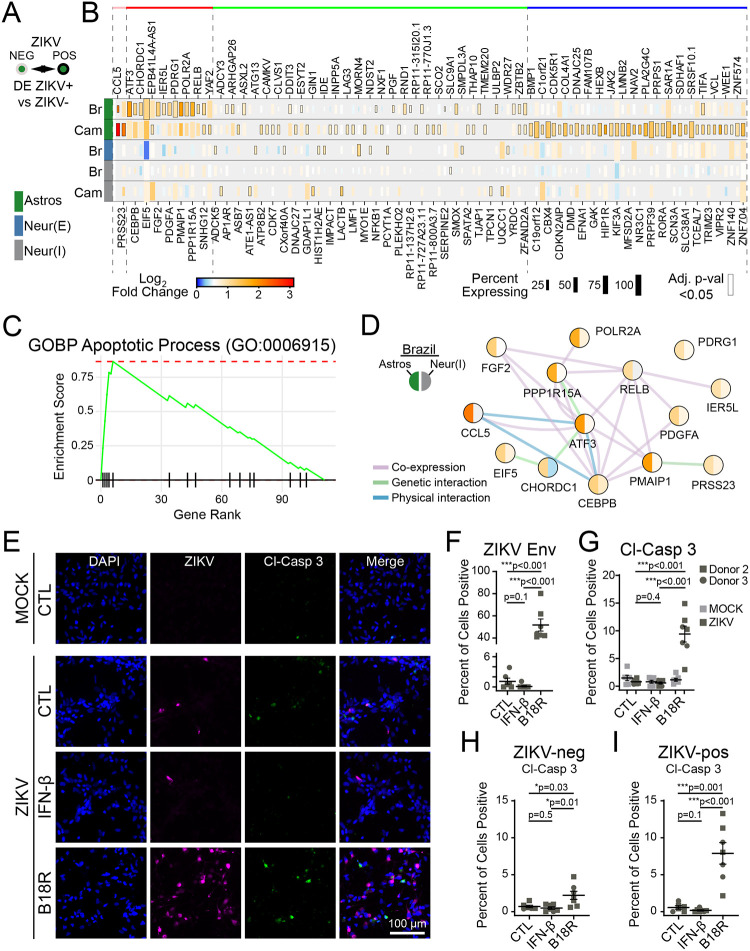
Figure 3. ZIKV infection drives cell-intrinsic apoptosis pathways limited by IFN-β.
(A-B) Bioinformatic comparison (A), and heat map (B; rows=infection condition, grouped by cell type) identifying DE genes in cells containing ZIKV reads, compared to bystanders without ZIKV reads in the same treatment conditions. (C) GSEA identified apoptosis signaling as the top pathway induced in ZIKV-infected cells, LFCs were used to rank genes. (D) Network map of ZIKV-induced genes pertaining to intrinsic apoptosis (color=log-fold change by scale bar in B, according to ZIKV-Brazil condition). (E) Immunocytochemistry of cleaved caspase-3 (green) expression as a function of ZIKV-Brazil infection (magenta) in cells treated with IFN-β or the IFN-β inhibitor, B18R. (F-G) Blockade of IFN-β led to an increase in the percent of infected cells (F) and also the percent of cells staining positive for cleaved caspase-3 (G). (H-I) Percentage of cells with activated caspase-3 staining, when considering only ZIKV-negative (H) or ZIKV-positive cells (I). N=two independent experiments, two donors for panels F-I. All graphs indicate mean ±SEM.

