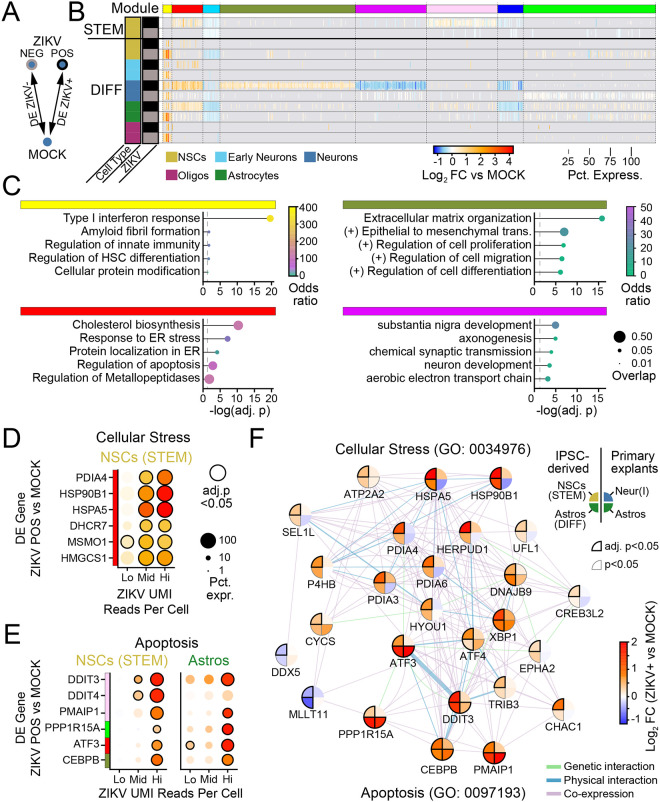
Figure 5. Universal ZIKV-driven transcriptional responses reflect cellular stress linked to apoptosis.
(A) Schematic of DE comparison. (B) Heatmap of DE genes according to cell type (row color) and ZIKV-positivity (grey and black row markers). K-means clustering of genes identified co-expression modules (top color bar) that are universal across cell types (e.g., red), modules that are specific to differentiated cells (e.g. yellow), and genes that are specific to neurons (magenta and forest green modules). (C) GSEA of four modules from B indicates that universal gene modules include IFN-β signaling (yellow) and cellular stress (red), while neuron-specific gene modules include extracellular matrix remodeling (forest green) and synaptic function (magenta). (D-E) Dot plots representing gene expression changes in ZIKV-positive cells (vs MOCK) as a function of the number of ZIKV UMI reads (x-axis), for genes pertaining to cellular stress (D) or apoptosis (E). Lo: 1–9 reads; Mid: 10–99 reads; Hi:>99 reads. Color: log-fold change indicated by color bar in F. (F) Network map linking cellular stress and apoptotic signaling in ZIKV-infected cells for iPSC-derived cells (left half) and primary fetal explants (right half). Color: log-fold change versus MOCK (for iPSC-derived cells, from cells with >99 ZIKV UMI reads).

