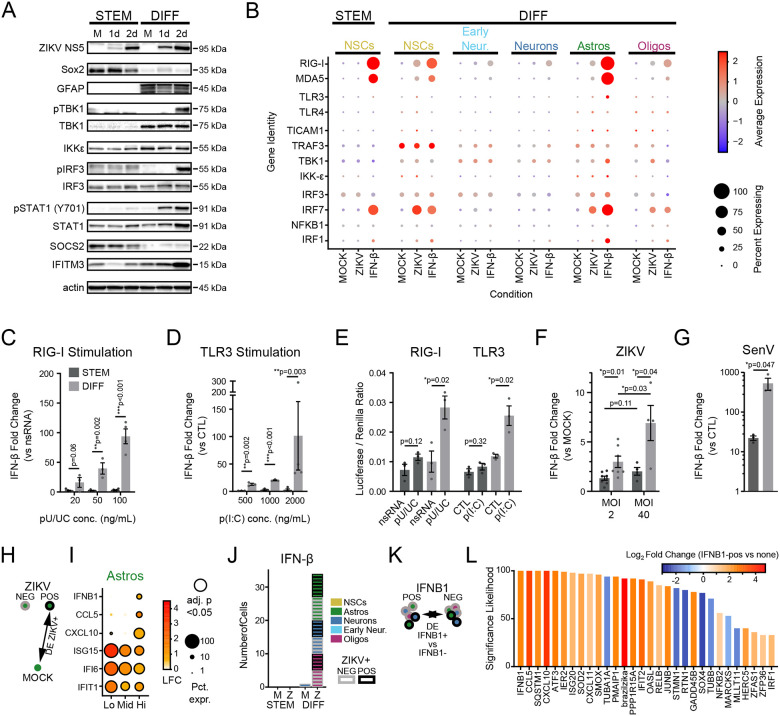
Figure 7. Failure of innate immune signaling in neural stem cells.
(A) Innate immune activity in neural stem cell (left) and differentiated cultures (right), as measured by phosphorylation of key signaling proteins (TBK1, IRF3, STAT1) after 1 and 2 days of ZIKV infection in bulk cultures. (B) Dot plot representing steady state, IFN-β-, and ZIKV-induced expression levels for innate immune signal transduction components in scRNAseq data. Color scale represents normalized expression (scaled median z-score across all genes and conditions in the plot). (C-D) IFN-β gene induction in bulk cultures by qPCR in neural stem cell (dark grey) and differentiated cultures (light grey), induced by treatment with a RIG-I agonist (C, poly(U/UC) transfection) or TLR3 agonist (D, poly(I:C) extracellular application). (E) Firefly luciferase activity, induced under control of an exogenous IFN-β promoter in response to poly(U/UC) or poly(I:C). Firefly luciferase was normalized to Renilla luciferase driven by a CMV promoter to control for transfection efficiency. (F-G) IFN-β induction in response to high ZIKV inoculum or the strong RIG-I agonist, Sendai virus. P-values on graphs in C-D represent unpaired t-test. (H-I) Differential gene expression comparing ZIKV+ cells to MOCK according to level of ZIKV RNA. Astrocytes significantly upregulated innate immune signaling genes (CXCL10, CCL5, IFNB1) at the highest level of ZIKV reads. (J) IFNB1-expressing cells according to cell type (color) and ZIKV infection status (border) across treatment conditions. (K-L) Differentially expressed genes (x-axis) in IFNB1-expressing cells as identified in (J), compared to IFNB-negative cells in the same treatment condition. Significance likelihood reflects bootstrap analysis of 100 DE comparisons and is a measurement of the percent of comparisons in which the gene fold change was identified as significant with adjusted p-value <0.05. Color reflects average log2-fold change across all comparisons.

