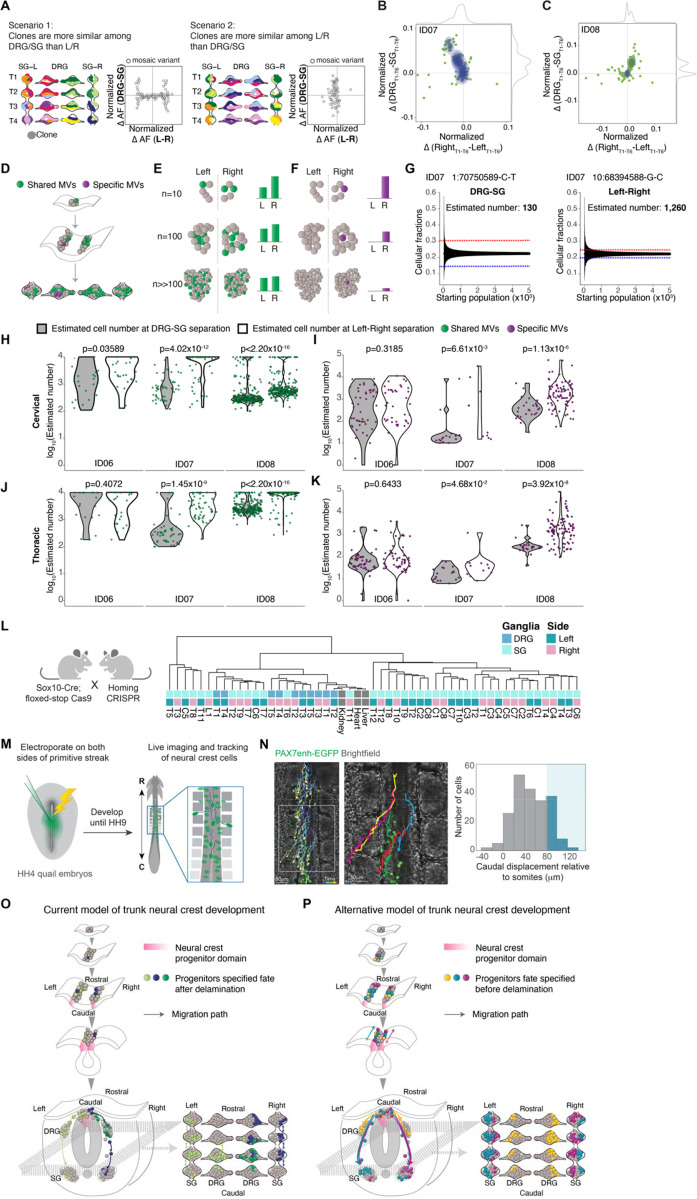
Figure 4.
Evolutionarily conserved clonal dynamics and timing of neural crest fate specification.
(A) Modeling two possible scenarios whereby clones are more similar among DRG/SG than Left/Right (scenario 1, left) or the opposite case (scenario 2, right). Schematic contour plots showing normalized difference in the allelic fraction (AF) of each MV between the DRG and SG (y-axis) against that between left and right (x-axis).
(B-C) Contour plots showing the normalized AF difference of each MV observed from ID07 (B) and ID08 (C) between DRG and SG (y-axis) and between left and right (x-axis). Green dots: individual MVs. Blue contour: 2D Kernel density MV estimation plots highlighted. Grey curves: kernel density estimation along the x- or y-axis. Most MVs spread along the y-axis, indicating a larger difference in AF between DRG and SG, while showing minimal left-right lateral difference.
(D-F) Schematics for effect of founder population size MV AFs. Green: MVs acquired during early embryogenesis before left-right split. Green variants therefore are shared in ganglia of both left and right but with varying AFs, whereas purple MVs are acquired only after the left-right split, thus distributed on one side exclusively. (E) AFs for green variant quantified under three hypothetical founder population cell numbers: n=10, n=100, or n>>100 shown. Larger hypothetical founder population size correlated with smaller AF difference between left and right. (F) For the purple lateralized variant, smaller number of cells immediately after left-right lateralization correlated with higher AFs.
(G) Estimation of the effective population size by the observed difference in AF as in (D-F). Representative variants from ID07 for calculating the cell number prior to DRG-SG split (left panel) and prior to left-right split (right panel). Blue and red dashed lines: difference in average AF for the individual variant between DRG and SG (left panel) or between left and right (right panel). Black lines: 95% bands of hypergeometric distribution from each simulated starting population size.
(H-K) Violin plots comparing estimated maximum number of founder population size at DRG-SG specification and left-right lateralization in cervical regions (H) or thoracic regions (J). Green dots: MVs distributed bilaterally; Violin plots comparing the estimated minimum size of the founder population at DRG-SG specification and left-right lateralization in cervical (I) or thoracic regions (K). Purple dots: MVs restricted to one side. The predicted population size at DRG-SG specification is significantly smaller than at left-right split when estimated from either class of MV. P-values: two-tailed Mann-Whitney U tests.
(L) Mouse breeding scheme for generating the neural crest-specific CRISPR barcoding mouse model. Migratory neural crest-specific Sox10-Cre driven Cas9 activity for in vivo barcode editing. Representative lineage tree dendrogram for the edited barcodes from 1-month-old mice. Bulk organs (liver, kidney, and heart) with limited NC contribution (n=2 independent mice).
(M) Experimental design for real-time ex ovo imaging of NC progenitor migration in quail embryos.
(N) Representative tracks showing migration paths of NC cells expressing H2B-Citrine under control of Pax7 enhancer. Histogram showing the rostrocaudal migration distance of 212 cells tracked (n=6 embryos). Blue shading indicates cells migrating caudally by more than 1 somite (mean somite length 81 ± 1 μm, n=92 somites from 6 embryos). Right panel: magnification of boxed region from left panel. Brackets: somites. Scale bar: 50μm.
(O-P) Trunk NC development current model (O) and the alternative model observed from this study (P). The current model has little in the way of rostrocaudal cell movement prior to NT closure, and that individual clones populate both DRG and SG (depicted by green or purple cells in both types of ganglia, mostly restricted to one side). The alternative model includes rostrocaudal cell movement prior to NT closure, and that individual clones populate either DRG or SG bilaterally but infrequently populate both DRG and SG (depicted by yellow cells in DRGs on both left and right, and both turquoise and violet cells in SGs on both left and right).

