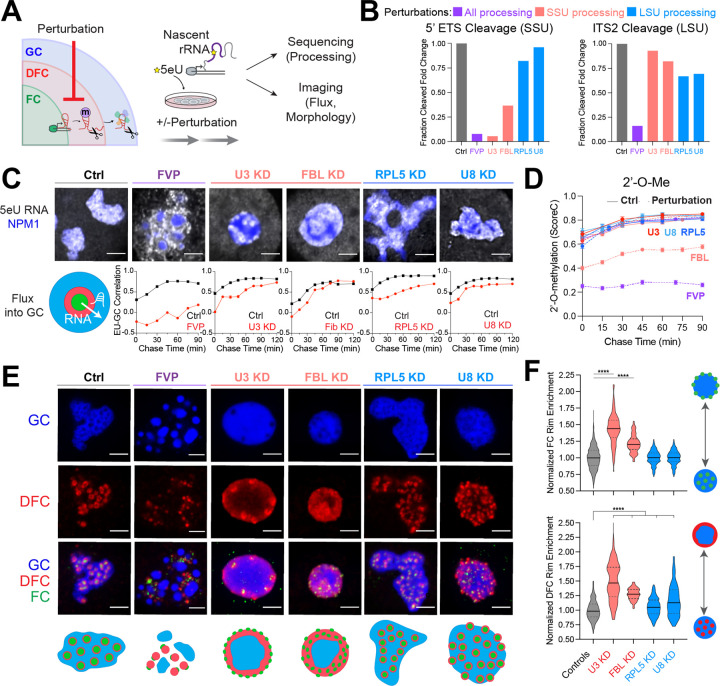
Figure 2: Impaired rRNA processing impacts rRNA flux and alters nucleolar morphology.
(A) Cells were treated with various pre-rRNA processing perturbations followed by 5eU pulse chase. 5eU-seq measures defects in pre-rRNA processing while 5eU imaging measures the flux of nascent RNA through the nucleolus as well as nucleolar morphology changes.
(B) Fold change in 5’ ETS cleavage (junction 1) or ITS2 (region downstream of 3’ junction) measured using 5eU-seq upon different perturbations: 2 μM Flavopiridol (FVP) treatment (general processing inhibitor, purple), knockdown (KD) of SSU processing factors (U3 snoRNA or FBL, red), or LSU processing factors (RPL5 or U8 snoRNA, blue).
(C) Representative images of 5eU-labeled RNA (white) in nucleolus (mTagBFP2-NPM1) after 60 min chase in control and in various perturbation conditions. Quantification of 5eU correlation with NPM1 (GC) 0–120 minutes after transcription (chase time) upon all perturbations.
(D) Average 18S and 28S rRNA 2’-O-Me levels (quantified by ScoreC) by 5eU-seq upon all perturbations (dashed lines) or control (solid lines) across 0–90 min after transcription (chase time).
(E) Representative images and schematics of GC (NPM1, blue), DFC (FBL, red), and FC (RPA194, green) labeled with IF for all conditions except for FBL KD, where mTagBFP2-NPM1, NOP56-mCherry, RPA16-GFP was used.
(F) Quantification of FC and DFC enrichment on the rim of the nucleolus in control and all perturbations (normalized to control average value). Violin plots are centered by median (solid line) and quartiles are shown (dashed lines). **** p-value < 0.0001 (two-tailed Mann-Whitney test) n = 1116 (Controls), 97 (Fib), 228 (RPL5), 153 (U3), 105 (U8) cells. All scale bars = 3 μm. All error bars are s.e.m.

