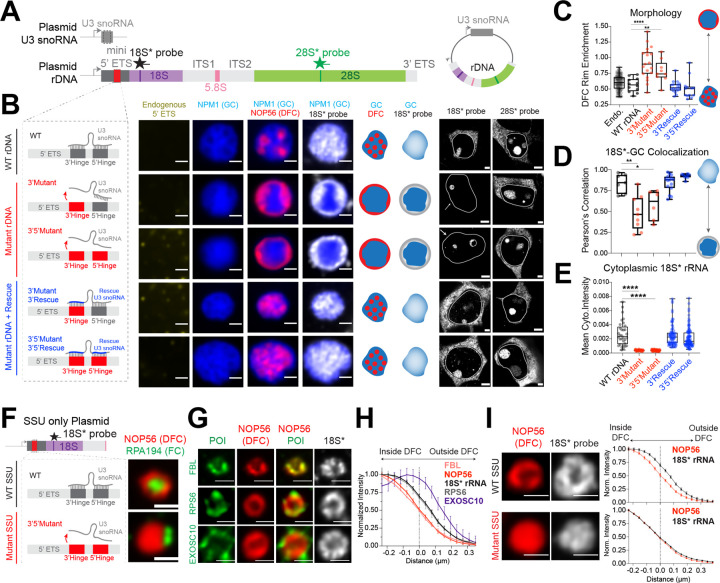
Figure 4: SSU processing drives the layering of the multiphase nucleolus and the outflux of SSU precursors from the nucleolus.
(A) Schematics of plasmids expressing both U3 snoRNA and synthetic rDNA with various mutations at U3 binding sites (red). Refer to Supplementary Figure 8C–G for details.
(B) The nucleolar morphology of de novo nucleoli as shown by the lack of endogenous 5’ ETS signal (yellow) labeled by GC (mTagBFP2-NPM1; blue) and DFC (NOP56-mCherry; red) from plasmids with normal U3 hybridization sequence, 3’ hinge mutations, 3’,5’ hinge mutations, or mutant U3 snoRNAs that rescue the hybridization. Schematics illustrate nucleolar morphology and 18S* (plasmid) rRNA localization. Cytoplasmic signals for plasmid-expressed 18S and 28S rRNAs for each condition are shown along the side. Solid lines demarcate individual nuclei. See Supplementary Figure 10B–D for all morphologies reproduced without overexpression (using IF) and visualization of all 3 nucleolar phases.
(C) Quantification of DFC enrichment on nucleolar rim (rim enrichment score) for all plasmids in B. **** p-value < 0.0001; ** p-value = 0.0024 (two-tailed Mann-Whitney test); n = 95, 12, 19, 9, 18, 13 nucleoli
(D) Pearson’s correlation of nucleolar 18S* signal with the GC phase (NPM1) of the nucleolus, quantified from all plasmids in B. * p-value = 0.0221; ** p-value = 0.0012 (two-tailed Mann-Whitney test); n = 7, 9, 6, 15, 8 nucleoli.
(E) Quantification of cytoplasmic 18S* signal from B. **** p-value < 0.0001 (two-tailed Mann-Whitney test). n = 32, 38, 58, 79, 102 cells.
(F) Schematics of wild type (WT) or mutant SSU only plasmids, refer to Supplementary Figure 8B for details, and example images of nucleoli formed by these two plasmids, labeled with DFC (NOP56-mCherry) and FC (RPA194 IF). Quantification of FC rim enrichment is in Supplementary Figure 11A.
(G) Visualization of protein of interest (POI, shown in green), in WT SSU only nucleoli demarcated by NOP56-mcherry (red), including processing factors FBL (IF), EXOSC10 (IF), and ribosomal protein RPS6-Halotag. Plasmid-expressed 18S* RNA is shown in white.
(H) Quantification of the radial distribution of 18S* RNA and factors in g around the DFC boundary (distance=0 is defined at 50% of maximal NOP56 signal). n = 74 (Nop56, 18S), 87 (FBL), 21 (RPS6), 12 (EXOSC10).
(I) Examples of DFC (NOP56-mCherry) and 18S* in WT vs mutant SSU only nucleoli with their radial distribution quantified. All scale bars = 1 μm except for the right part of B (= 3 μm); n = 74 (WT SSU), 164 (Mutant SSU) nucleoli. Box and Whisker Plots: Median plotted, Boxes span 25th to 75th percentiles, Whiskers span min-max values. All error bars are s.e.m.

