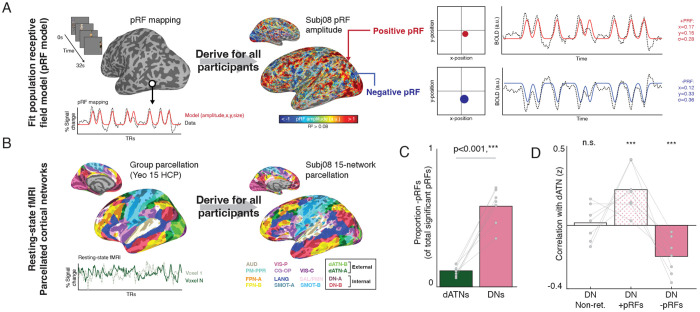
Fig. 1.
Inversion of retinotopic coding between externally- and internally- oriented networks in the human brain. A. Population receptive field (pRF) modeling with fMRI. A visual pRF model was fit for all participants to determine visual field preferences for each voxel. Voxels with positive BOLD responses to the visual stimulus are referred to as positive pRFs (+pRFs), and those with negative BOLD responses are referred to as negative pRFs (−pRFs). B. Individualized resting-state network parcellation. Resting-state fMRI was collected in all participants (N=7; 34-102 minutes per participant) and used to derive individualized cortical network parcellations. Parcellations were generated using the multi-session hierarchical Bayesian modelling approach8,40 with the Yeo 15 HCP atlas44 as a prior. C. Differential concentrations of +/−pRFs in task-negative and task-positive (internally/externally oriented) brain networks. Bars show the proportion of −pRFs (of total suprathreshold voxels) within each individual’s cortical networks. The dATN (combined dATN-A/B) had the lowest proportion of −pRFs, while the DN (combined DN-A/B) had the highest. All networks’ concentration of −pRFs are shown in Fig., S3. D. Interaction between the DN and dATN differs by visual field preference of DN voxels. DN voxels with +pRFs had a positive correlation with the dATN (mean correlation = 0.22±0.144, t(6) = 3.99, p = 0.0072), while non-retinotopic DN voxels (i.e., pRF model R2 < 0.08) were not significantly correlated with the dATN (mean correlation = 0.02±0.115, t(6) = 0.37, p = 0.72). On the other hand, DN voxels with −pRFs were anti-correlated with the dATN (mean correlation = −0.20±0.12, t(6) = 4.22, p = 0.0055). To conduct these analyses, we accounted for variance associated with other cortical networks using partial correlation43.

