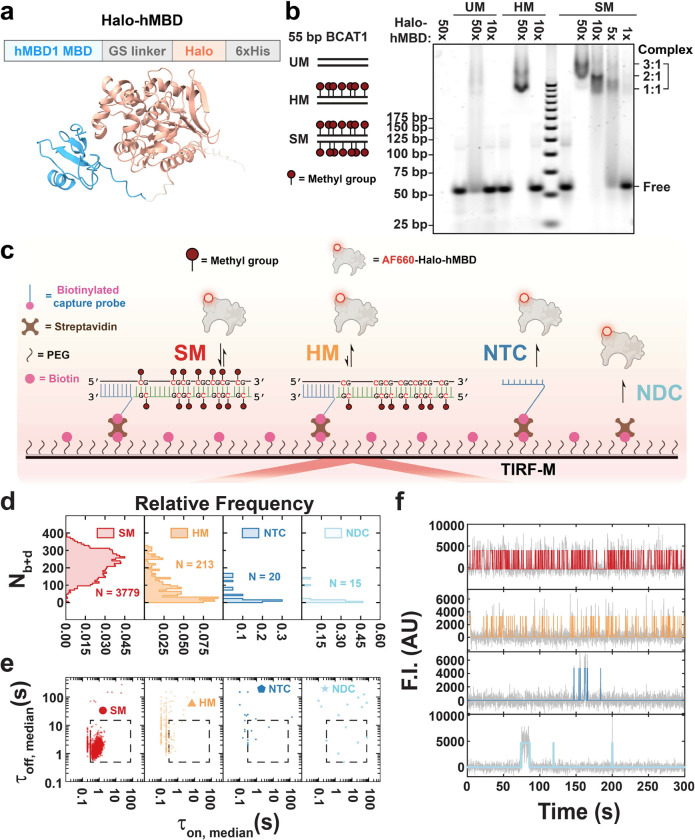
Fig. 1 |. MBD-Halo shows methyl-CpG-binding activity in both ensemble and single-molecule measurements.
a Predicted structures of MBD-Halo by AlphaFold2. See Supplementary Table for input parameterization. b EMSA of MBD-Halo binding to three types of 55 bp BCAT1 promoter substrates with different methylation states: SM (symmetrically methylated DNA), HM (hemimethylated DNA), and UM (unmethylated DNA). MBD-Halo was mixed with DNAs at different molar ratios. c Schematic of single-molecule fluorescence microscopy for studying MBD binding to surface-tethered methylated DNA. NTC, non-target control; NDC, non-DNA control. d,e,f Nb+d distributions (d), median dwell time distributions (e), and representative intensity-time traces (f) under four different conditions: SM, HM, NTC and NDC. N, number of detected molecules of one field of view (FOV). Gray lines and colored lines in panel f represent raw and idealized traces by hidden Markov modeling respectively. F.I., fluorescence intensity; AU, arbitrary unit.

