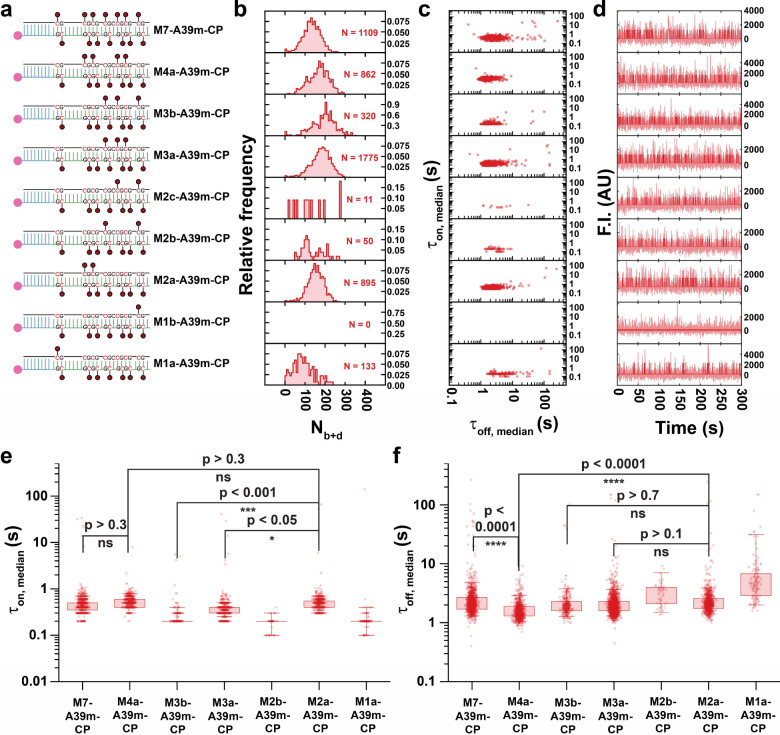
Fig. 4 |. Tandem symmetrical methylation boosts methyl-binding activity of MBD in methylated duplex DNA.
a-d Designs of M7-A39m-CP, M4a-A39m-CP, M3b-A39m-CP, M3a-A39m-CP, M2c-A39m-CP, M2b-A39m-CP, M2a-A39m-CP, M1b-A39m-CP, and M1a-A39m-CP, as well as their Nb+d distributions, dwell time distributions and representative intensity-time traces. In panel d, semi-transparent lines in the background are raw traces and solid lines are idealized traces by hidden Markov modeling. F.I., fluorescence intensity; AU, arbitrary unit. e,f Boxplot comparison of τon,median and τoff,median distributions respectively, across designs showing significant detected population. Boxes are drawn from Q1 to Q3 with whiskers from 5% percentile to 95% percentile. P-values smaller than 0.05 are assessed using a single-tailed unpaired t-test and P-values higher than 0.05 are assessed using a two-tailed unpaired t-test.

