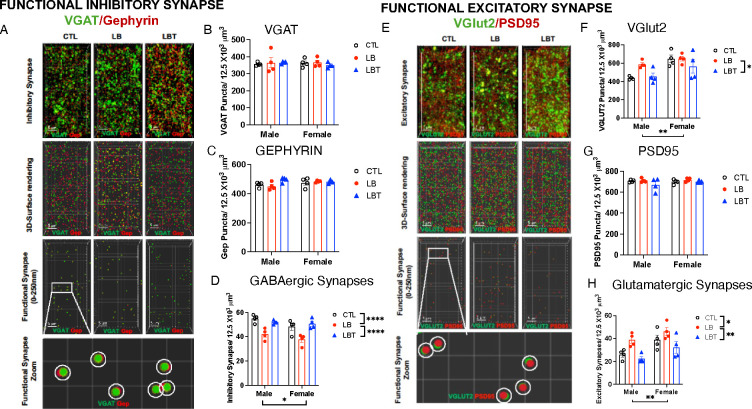
Figure 3. Effects of LB and LBT on GABAergic and glutamatergic synapse densities in the OFC.
A. Confocal images and Imaris models of VGAT and GEPHYRIN staining in the OFC. B. VGAT puncta density. ANOVA, rearing: F (2,18) = 0.16, P= 0.85, sex: F (1,18) = 0.049, P= 0.83, interaction: F (2,18) = 0.29, P= 0.75. C. GEPHYRIN puncta density. ANOVA, rearing F(2,18) = 2.63, P=0.099, sex: F (1,18) = 1.80, P= 0.19, interaction: F (2,18) = 2.53, P= 0.11. D. GABAergic synapse density. ANOVA, rearing: F (2,18) = 20.43, P< 0.0001, sex: F (1,18) = 5.55, P= 0.03, interaction: F (2,18) = 0.85, P= 0.44. Post-hoc, CTL vs. LB: P< 0.0001, LBT vs. LB: P< 0.0001, CTL vs. LBT: P= 0.99. E. Confocal images and Imaris models of VGlut2 and PSD95 staining in the OFC. F. VGlut2 puncta density. ANOVA, rearing: F (2,18) = 3.72, P= 0.044, sex F (1,18) = 14.88, P=0.0012, interaction: F (2,18) = 1.75, P= 0.20. Post-hoc, CTL vs. LB: P= 0.20, LBT vs. LB: P= 0.048, CTL vs. LBT: P= 0.84. G. PSD95 puncta density. ANOVA, rearing: F (2,18) = 1.75, P=0.20, sex: F (1,18) = 0.65, P= 0.43, interaction: F (2,18) = 0.79, P= 0.46. H. Glutamatergic synapse density. ANOVA, rearing F (2,18) = 9.92, P= 0.0012, sex: F (1, 18) = 12.57, P= 0.0023, interaction: F (2,18) = 0.32, P= 0.73. Post-hoc, CTL vs. LB: P= 0.025, LBT vs. LB: P= 0.001, CTL vs. LBT: P= 0.32. CTL n=8, LB n= 8, LBT n=8, half are females, from 5–6 different litters per group.

