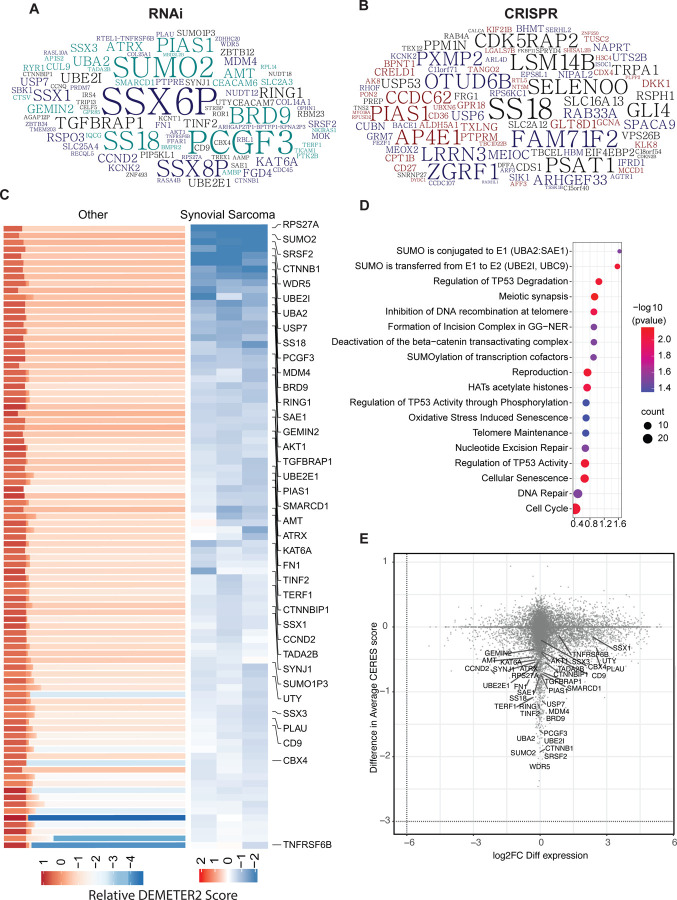
Figure 1: Synovial sarcoma dependencies identified through DepMap screens:
A-B) Top 200 genes identified as selective dependencies using T-statistic scores of (A) RNAi data or (B) CRISPR screening data are shown in the word cloud. Font size is proportional to the negative log 10 adjusted p value with a larger font indicating a higher dependency of the gene in synovial sarcoma cell lines compared to all other cell lines in the DepMap database.
C) Heatmaps representing DEMETER2 scores, as a quantitative dependency metric of human synovial sarcoma cell lines to each gene in RNAi screens. Relative DEMETER2 scores for non-synovial sarcoma cell lines (left) compared to synovial sarcoma cell lines (right) are depicted for the top differentially essential genes.
D) Bubble plot displays the top significantly enriched pathways in the REACTOME database with adjusted p values < 0.05.
E) Scatter plot showing the relationship between gene dependency (measured by the difference in average DEMETER2 scores) and differential transcript expression (log2 fold change FC differential expression) for all genes, with key synovial sarcoma selective essential genes labeled.

