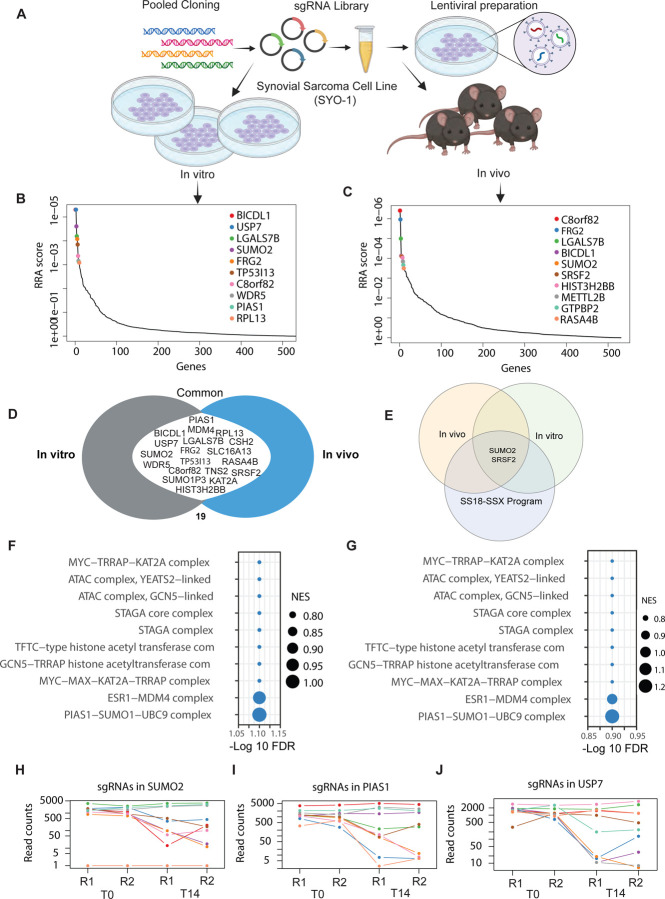
Figure 2: In vivo and in vitro screening reveal top synovial sarcoma-selective dependencies:
A) Schematic representation of in vivo and in vitro pooled CRISPR screens in HS-SY-II cell line.
B-C) Analysis of pooled in vitro (left) and in vivo (right) CRISPR/Cas9 screens using the MAGeCK RRA algorithm. Plot shows the relationship between genes (X-axis) and their statistical significance (RRA score) (Y-axis). The top 10 significant genes are labeled. RRA is robust rank algorithm as assessed using MAGeCK.
D) A Venn diagram illustrating genes commonly essential in both the in vitro and in vivo pooled CRISPR/Cas9 screens. Common genes in the union are labeled.
E) A Venn diagram illustrating genes common to the in vitro and in vivo screens as well as in the core synovial sarcoma oncogenic program. Common genes in the union are labeled.
F-G) Pathway enrichment of hits in the in vitro (F) and in vivo screens (G) screens. -log10(FDR) of false discovery rate is shown on the X-axis. The size of the bubbles indicates normalized enrichment scores of each pathway.
H-J) Normalized read counts of multiple individual sgRNAs for SUMO2 (H), PIAS1 (I) and USP7 (J) showing the difference between T0 and T14 time points.

