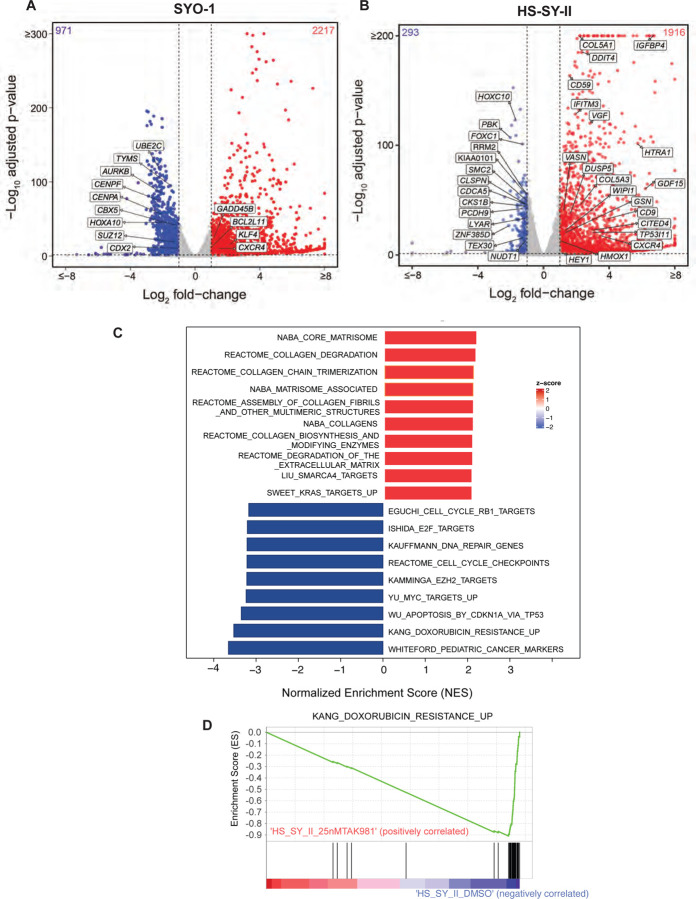
Figure 4: Broad transcriptomic changes in TAK-981 treated synovial sarcoma cell lines.
A-B) Volcano plot illustrating differential gene expression in SYO1 (A) or HS-SY-II cells (B) treated with DMSO compared to TAK-981. Each dot represents an individual gene. The X-axis represents log-2 fold change (DMSO Vs TAK-981 treated cells) and the Y-axis represents -log10 BH adjusted p-value. Red dots represent genes significantly upregulated in the TAK-981 treated compared to the DMSO treated arm with adjusted p-value <0.05 and fold change >2. Blue dots represent genes that are significantly downregulated with p-value <0.05 and fold change <0.5. Grey dots represent genes that are not significantly differentially expressed.
C) The bar chart represents top 20 significantly enriched gene ontology (GO) terms of the C2: canonical pathways gene set. The horizontal axis represents pathways with positive (red) and negative (blue) normalized enrichment scores (NES).
D) GSEA analysis of the C2 Curated Datasets in MiSigDB for genes upregulated during doxorubicin resistance is shown for transcriptomic data of HS-SY-II cells treated with DMSO compared to TAK-981. NES = Normalized Enrichment Score.

