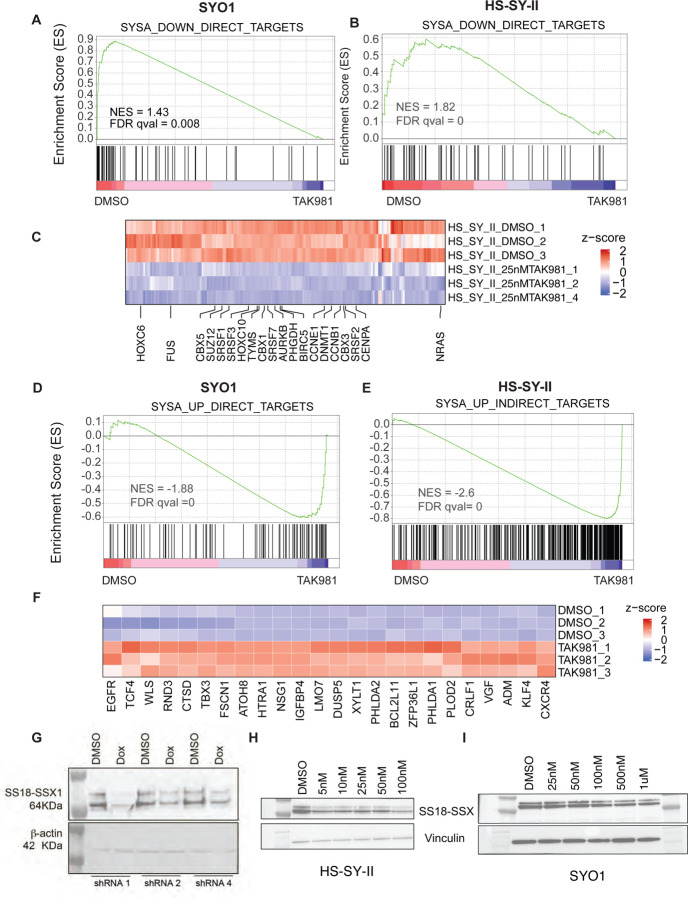
Figure 5: Treatment with TAK-981 leads to downregulation of oncogenic program in synovial sarcoma cell lines.
A-B) GSEA analysis of SS18-SSX fusion-activated genes in SYO1 (A) or HS-SY-II (B) cells treated with DMSO compared to TAK-981 is shown. Enrichment plots depict genes that are direct targets of the SS18-SSX fusion, which are downregulated upon SS18-SSX fusion knockdown (thus, SS18-SSX-activated genes). Black vertical lines at the bottom indicate positions of individual genes in the set, with the green line representing the cumulative enrichment score (y-axis). A positive normalized enrichment score (NES) indicates enrichment in the upregulated genes in SYO1 cells (A) and HS-SY-II cells (B). FDR q values are indicated.
C) Heatmap displaying SS18-SSX fusion-activated genes that are reduced in TAK-981 treated compared to DMSO treated HS-SY-II cell line are shown. Select genes implicated in SySa pathogenesis are labeled.
D-E) GSEA analysis SS18-SSX fusion-repressed genes in SYO1 (D) or HS-SY-II (E) cells treated with DMSO compared to TAK-981 is shown. Enrichment plots show genes that are indirectly repressed by the SS18-SSX fusion and are thus upregulated upon SS18-SSX fusion knockdown. A negative NES indicates higher expression enrichment of these genes in the TAK-981 compared to DMSO arms in SYO1 (D) as well as HS-SY-II cells (E).
F) Heatmap displaying SS18-SSX fusion-repressed genes that are increased in TAK-981 treated compared to DMSO treated HS-SY-II cell line are shown. Select genes implicated in SySa pathogenesis are labeled.
G) Immunoblot analysis of whole-cell lysates from HS-SY-II cells stably expressing SUMO2 knockdown in a doxycycline-inducible system (shRNA1, 2, and 4), probed for the SS18-SSX1 fusion protein with Vinculin as a loading control is shown.
H-I) Immunoblot analysis of whole-cell lysates from HS-SY-II (H) or SYO1 cells (I) treated with varying denoted concentrations of TAK-981 and probed for the SS18-SSX1 fusion protein with are shown. Vinculin is shown as a loading control.

